Author Archives: mrmillermath

The Elements Of A Great Lesson.

A great lesson doesn’t not need all of these elements, but as teachers we need to understand the lens we use when selecting what our students will spend their time doing.  So with that:

Great lessons …

… have a low floor and a high ceiling.  I was reading a Desmos blog post about how they think about great digit activities and they wrote:

 “Create activities that are easy to start and difficult to finish”

I like that a lot.  But what makes a low floor?  Probably depends, but you must make sure that every student in your class can participate in the beginning of the lesson.  The more interesting the hook the better.  Can you get a debate going during the introduction of the lesson?

The simplest metric here might be “Can they make estimates on the answer before beginning the lesson?”

… have more than one way to figure it out.  It doesn’t have to have lots of ways – even if there are only two ways that’s still good.  It’s important to be able to compare and contrast approaches.  Sometimes this “open middle” if you will is only apparent for part of the lesson.  For example, I have students measure the height of our stadium lights using an inclinometer.  They take measurements from two different distances.  This lesson is awesome, but there is only one way to do it.  After they get their two answers (one from each distance) I ask them “Which distant do you think is more accurate?”  Now we have opened up that problem a lot.  The main content outcome had only one way but you can bring in an openness by the questions you ask throughout.

… are ones where you don’t immediately know how to do it, but you think you can figure it out.  This is a subtle place.  The book “Make It Stick” labels this as “desirable difficulty”. It’s hard to put your figure on what makes this true but there are definitely questions that students get where they say ‘I don’t know how to do this and it’s too difficult for me to figure out”.  And that is not a clear constant line for every student but you don’t want anyone in the room thinking that at the beginning of a lesson.

Ms Pac Man hits this mark pretty good.  Students generally don’t know how to get her all along that path but they believe they can do it.  So when they hit that first turn where she reflects and rotates they are like “this is strange”, and they immediately move into trying to figure out that turn.  They believe they can do it with effort and collaboration.

Pro – tip.  You must help them without thinking for them.  So you must know how they are thinking….   so you must listen to them and not assume that you already know what they are thinking.

Lastly, frame all hints as “break throughs” and attribute them to the students and groups where the idea emerged from.

… have a surprise ending.  Anytime our intuition turns out wrong become intrigued.  Almost like we don’t believe it or something (“No way – this can’t be right”).  One of my favorite examples of this occurs during Mathalicous lesson “As The World Turns”.  After students calculate the speed someone on the equator is moving due to the earths rotation you point them to where they are located on the graph and ask “Are we traveling at the same speed, faster, or slower than someone on the equator?”  The students who believe we are traveling at the same speed eventually sit at the edge of their seats when they learn they are wrong.  It’s time to be convincing and go for that ride.

I’m a bit of time so here are a few more ideas that I’ll present without explanation:

… allow for conversations that are important irrespective of the mathematics, use technology, have manipulatives, ask students to measure and collect data, have students create something, connect art & mathematics, ….

It’s interesting, I have having some trouble differentiating between the elements of a great lesson, and elements of great teacher moves.  Most of the ideas that are coming to mind feel more like teacher moves rather than static elements that exist naturally within a lesson.

Origami Duck – Focus On Angles

I ended up having this go over two days and looking back I’m very glad I did.  Here are my notes for day one of the lesson which is where they folded the model.  For specific folding instructions – go over to georigami.com and watch Dave and I fold the duck.  I recommend watching the “For Educators” video.

When I write out my plan I like to be very direct my main focus – but I also note any questions I want to pause on that aren’t part of my main content goal.  So in this case – my main goal is the angle bisector and angle measures, but you can see I have carved out a specific time when I am going to deviate from that and do a ‘what do you notice’ on the step when they first fold the kite.

Day 1:  Fold the duck and find all missing angles.  Not worrying about having to provide justifications (warrants) and notation.  I focus on introducing the angle bisector because ultimately they are going to be solving for angles and almost each one is specifically related to a bisecting.

As I show in my notes – I did pause after each bisecting and had them figure out what the resulting angles were and mark the angles as congruent directly on their origami model.

I gave them individual time to figure out the angles right there on the origami model.  Then I grouped them and they went to whiteboards, drew the model on the board and solved it in teams.  I had a couple of the folding patterns printed out to help them draw it.   Just drawing the fold patterns is a lesson in itself since they have to draw the best square they can, and then attempt to properly bisect the angle.  To draw a bisector you must understand a bisector.

Origami Duck Real Fold Lines

I intentionally used the folding pattern without labels because I didn’t want anything to distract from figuring out what every angle was.  But I suppose you could label it with points.

Day 2:  No folding, they just completed the Origami Duck worksheet.  I had them do it all at whiteboards, but having them work it on paper is cool too.  The idea is that now they are using proper notation, and needing to provide warrants for each claim (unlike day 1).  I used the worksheet from georigami.  I added the structure of CLAIM/WARRANT because that is the language we are using this year.

Activity origami duck

The reason I broke it into two days is because this is the 4th day of the year and I didn’t want the structure of CLAIM/WARRANT or the notation of defining angles to get in the way of their conversations about the value of each angle.  The second day they needed to find specific angles called out in the worksheet, and format it in a two column style with CLAIM / WARRANT.

ORCHESTRATING THE END OF THE CLASS

My goal at the end of the 2nd day is to take the students around the tour of the room and look at the justifications.  I am looking for a group whose warrants are only the algebra steps they used.  Then I’m looking for a group who might have described what they did in words – “we cut the 45 degree angle in half”.  I would like to find a group that justified their responses with theorems (property of a bisector, triangle sum theorem) but didn’t show algebraic steps.  And lastly a group that did both – like one of the ones pictured below.

For me this is early in the year, so while the students are working I’m letting them take the word “warrant” and have it mean whatever they want.  My goal is for them to walk away with this distinction in mind:

Is it one thing to say the reason the angle is 67.5 is because 180-90-22.5 = 67.5.  But why does that algebra produce the correct answer?  What do you say to the person who doesn’t understand what gives you the right to do that?  You need to do more than just show the algebra, you must quote the theorem that supports the steps.

Or put in less words

Oh, I need to justify my algebra steps.

THEORY VS. PRACTICE

You might have notice this diagram in my notes above:

I have them put it in their notes.  It’s fundamental to my origami lessons.  Here’s why:  When you ask students to find the angles – is measuring the angles good enough?  My speech is that “theory” is what the angles should be – given that we started with a perfect square and did each origami fold perfectly.  They need to calculate angles based on “theory”.  Then I have them check their calculations by measuring what the angles actually are, which is the “practice”.  “There is always error in measurement” as Dave says.  So I don’t want them telling me their measurements and theory are identical.

At the end of the day the theory informs the practice and the practice informs the theory.  For example with the duck – the students might decide that on of those four congruent angles is 45 degrees.  But when they measure it they notice it is actually more like 22 degrees.  The reality of the angle provides insight into their calculation that they are not taking into consideration a bisector.

FOLDING HEADS UP

I didn’t pre-fold any models.  The duck is the first model I do and it has three inside reverse folds – so just be aware that they will find those difficult.  If I was to pre-fold I would pre-fold 8 models to where the neck is done but not the head.

Ok – that’s it.  It’s just a duck afterall.

Cheers!
– B


My Favorite Talking Point

If you first want an explanation of the Talking Point activity – click the following link:

Talking Points

Here’s my favorite talking point for developing the classroom culture for listening.  I have other favorite ones too 🙂

It’s impossible for other people to tell if you are listening

I would expect near 50% agree / disagree ratios.  I actually give out seven talking points for them to do but I only discuss the one above with the whole class.  Here are all seven that I use:

After we finish the activity I give them the following reflection prompt which does a nice job having the students confront that there are certain tells as to whether or not someone is listening:

Do you feel like you were being listened to?  Why?  Were you listening to others?  Do you think they knew you were listening?

Essentially, if you think you were being listened to – how do you know?  What were the signs?  If you think you weren’t being listened – why do you think that?

The conclusion at the end is that just listening is not enough.  You also must show the speaker you are listening.  We discuss how it is deflating to speak to a room when lot’s of people are looking down (unless it’s tmc of course).  Even though you may be listening while you are looking down, we in this class do our best to turn and face the speaker and make eye contact.

This year I’m having students stand when they tell me their tally and when I ask them for one the groups arguments.  So I get to further drive how the important of turning to face the speaker because when they are standing everyone can see them.

I don’t recall where the list I pulled these from is located – but I know they were definitely from @cheesemonkeysf.

Cheers!
– B

Golden Ratio & The Human Face Activity

The study of the human face is great place for the golden ratio, and thus also similarity.  As has often been the case lately – I need to pause and say that this activity was created my incredible colleague Dave Casey who is tour de force of resources, ideas, and inspiration in the math-art intersection.

This activity fits a human head into a primary rectangle (the rectangle that encloses the shape) that is a golden rectangle.  I’ve done this activity before exactly as the worksheet lays out.  I did the origami face above just for fun a couple days ago and enjoyed it a lot.  I liked that it didn’t have any lines to erase and had a cool, kind of 3D look to it.  But the worksheet itself doesn’t talk about folding paper, that’s an element I added.  Here are a couple things you need to consider for adding that element:

  • Mountain fold the vertical fold in the middle of the face.  This line is not in the worksheet but it allows the nose line to come out a little bit. (mountain folds are when you fold away from you and it looks like a mountain, valley folds are when you fold towards yourself and it looks like a valley)
  • Alternate mountain and valley folds.  So in the image above the eye line is a valley fold, so the nose is a mountain fold, and the mouth is a valley fold.
  • I used the height of a regular piece of 8.5X11 printer paper.  So the first fold is actually the one needed to make the paper into a golden rectangle.  This is also the first thinking moment as the students need to figure out how wide the paper needs to be if the height is 28 cm (or 11in).  It could be fun to also initially play on intuition and just hold up a piece of paper and ask them if they think it is too narrow, too wide, or just perfect to fit a human face.
  • During the folding I was thinking of the forehead line and mouth line as a reflection of each other.  Origami is great for folding reflections and it opens another avenue for review during this lesson.

You might do the face with folding first and then have them do the activity exactly as defined in the worksheet.  Notice the high ceiling element where they make slight changes the ratios of the primary rectangles they fit the face into, and see how they effect the human face.  Here’s the results:

The Goods:

Here are pdf’s and Word files for it:

Ratio Faces (pdf)

Ratio Faces (doc)

The Hook & The Spiral:

Dave has a great way to introduce this activity that turns the correct proportions into a surprise ending and also brings in stats.  He guides the students to drawing a golden rectangle for them to use as a primary rectangle, and then has them sketch a face inside it.  Here’s the one I drew when I first observed Dave do the lesson:

Then he has them measure the ratio of the height of the face, to the eye height.  He collects all the data and has the students make a box plot.  The correct answer of about 0.5 is usually outside the box!  People always put the eyes too high on the face.  It’s cool because now when you tell them the correct ratio is 0.5 and the eyes are pretty much in the middle the students get this ‘my intuition was wrong, I just learned something, that’s interesting, give me more’ moment.

The Inspiration:

We’ll have to ask Dave for the inspiration to the lesson itself, but my inspiration for wanting to add origami to it comes from this clip from the documentary “Between the Folds” where the Eric Joisel quickly folds the rough form of the human face.  This lesson doesn’t achieve the form like Eric was able to do but watching him got me playing around with the idea of proportion and origami.  I would still love to have an origami face lesson more similar to what Eric created.  Any one?

I did learn some sad news while looking for the clip – Eric Joisel passed away in 2010.  Looks like the world lost a true artist.  Here is the New York Times article on his passing.

salute,
-B

Adding To Ms Pac Man

This post is about two new additions to way I taught Robert Kaplinsky’s Ms Pac Man lesson and I recommend them because they made the experience in my class even better (and it was already one of my favorites).  I wrote about the lesson previously here.  And Deb Boden wrote about it here.

New Addition #1 – Conditions for the double move

I thought of this the day before I did the lesson and I was excited about it – but I didn’t even realize the two improvements it would lead to (namely providing strategy to the game, and providing a way for students to check their solutions).

Here’s what I did:  After a few students start to run into that first corner where Ms. Pac Man needs to do more that just rotate – I still waited for a critical mass and then grouped students and had them navigate that turn together at whiteboards.

But when they sat back down I hit them with this challenge (which is the new element):

“Find other conditions for a double move”

We had established that if she is moving up and wants to go left that she will need to do more than just rotate.  When else will this be true?  I gave them about 10 minutes of alone time and after that had a class discussion.

You will have students who don’t feel comfortable enough with the transformations to handle a question like “Find other conditions for a double move”.  If I saw students not progressing, I would walk by them and something like “If she is moving left and wants to go down, will this need to be a double move?”.  Then come back to them and ask “What other times will she need to do a double move?”

Turns out that every left turn and every turn when she is moving left will require two moves.  There are two reasons why that is a great discovery from the lesson perspective:

#1:  Now when they play the game to score the most possible points in 20 moves they can have a strategy.  Minimize these moves that take two transformations.  And they did!  This year over half the class was even mapping out their entire path before actually recording the individual moves.  They were counting out the moves per turn and trying to minimize the number of left turns.  The students recording each move also seem to be doing so with increased strategy.

#2:  If you are doing the activity Robert suggests where they figure out all the transformations to complete the path on the screen, you’ll always get some form of this question:  “Mr Miller I’m done but I don’t know if it’s right”.  Now you can challenge them to count up how many moves it should take based on knowledge of which turns are a double and which are a single.  If they used a different number of moves then they probably made a mistake somewhere.  This type of self check on the answer helps extend the activity because the early finishers have something to do.

A Subtle Distinction

If you notice in the image above I had written “triple” move instead of double move.  That’s because students disagreed on whether they should count the translation as a separate move or not.  That happened because one of my students offered the beginning move as a double because it’s a reflection and then a translation.  But if that’s a double, then our “double” moves (reflection, rotation) were actually triple (reflection, rotation, translation).  This was probably one of the most subtle distinctions that I have had an active group conversation about with my students.  Loved. Every. Minute.


New Addition #2 – Draw the resulting orientation of Ms Pac Man after each move.

I got this idea from Alex Wilson and it was very effective.  I recommend it highly.  Last year I just had them write all the transformations without the additional image of Ms. Pac Man.  Have them keep track of Ms Pac Man’s orientation after each move.

I also – mostly in the moment – came up with a way to address a very common mistake without telling them the answer, so here it is:

Anticipation – Here is a way to navigate a common mistake:

Lastly – I definitely recommend having them say exactly what line they are reflecting over, rather that just vertical or horizontal reflection.  And when you do that you are sure to have some student always write “reflect over y-axis” for every vertical reflection, and “reflect over x-axis” for every horizontal reflection (when really they are reflecting over y=h or x=k).  So what I did this year after I noticed a critical mass doing that in one of my classes, I asked everyone to sketch an x-y axis and put Ms. Pac Man in the first quadrant.  Like so:

Then I told them to reflect her over the y-axis.

That was pretty much all they needed to see for them to realize that Ms. Pac Man is not reflecting over the y-axis in the game.  Then I had them draw a line through Ms Pac Man and reflect her over that line, as well as the x-axis.  The next day, and I’m not kidding on this – not a single group of 2 students had her reflecting over the wrong line (although one group had her reflecting over points).  Turned out to also be a great spiraling of reflecting shapes.

This post is really about having more in our back pocket as we try provide this learning experience to our students as best we can.

By the way – I did the lesson over two days.  I did the opener that I blogged about previously on day 2, where they send Ms Pac Man around the plus sign.  Here are 9 of the 12 whiteboards groups I had (that’s the most I can fit on an image)

Cheers!

-B


Sideboard Design – Scaling & Similarity on VNPS

I love this lesson for a variety of reasons – one being that they initially scale down a rectangle, and then they scale up a design and watch it fit perfectly into their original rectangle.  Scaling down and up, woohoo!!!

The abstract would call this a four step process:

1.  Draw a primary rectangle on the board that will represent the desired size of the sideboard.  It should be actual size – they are usually 30″ to 36″ tall.

2.  Scale down that rectangle to fit on a piece of paper using a scale factor they create.

3.  Design a sideboard on paper and measure all relevant dimensions.

4.  Scale the design back up to it’s actual dimensions and fit it into the original primary rectangle.

The Workflow:

I had them in groups of 2 and 3.  Everyone in the group starts with the same primary rectangle.  They choose a scale factor and scale it down.  Now each member of the groups designs their own sideboard.  They measure the necessary dimensions and then scale them up to what they should be in real life.

Once each group member had a design and knew what the scaled up dimensions were going to be, the group choose which design they were going to actually draw full size.

Once students were finished with the design I asked them to calculate the area of the primary rectangle in ft^2 and in^2.

In Retrospect:

Some students designed in only integer dimensions.  I would require one of the dimensions in the design be a non-integer value.

Only two groups ended up actually using a primary rectangle that didn’t have integer values.  Next year I think it would be cool to do this activity again but require them to use one of the dynamic rectangles as the primary rectangle.

Also they would make design decisions based on aesthetic reasons, rather than making decisions based on the simplicity of the measurements.

Students could also look up sideboards online and to get design ideas.

Two Sneaky Reasons Why It’s Great:

1:  Beginning with the primary rectangle offers an aha moment when they scale their design up and it fits perfectly inside the original rectangle.  If they just scaled their design up based on a scale factor they would say – “yeah, well this looks right”.  But since their rectangle is already on the board, the fact that the design fits right into is feedback that they scaled it correctly.

2:  Kind of similar to above but they get to see the actual area.  So when I ask them to find the area of the primary rectangle and they calculate 15ft^2, they can look at it and say “yeah, that’s actually what 15ft^2 looks like”.  I mean how often do they calculate an area and never experience the actual size of the thing they are calculating [answer:  too often].

Teaching Moments:

One of my favorite was when students began drawing their rectangles on paper and I got to ask them “What’s your scale factor?” and listen to them justify their selection.  Not each group went with 1″:12″, because it made their drawing too small.  A lot of groups went with 1″:6″, and some of those groups communicated that as 2″: 1′.

Supplies:

Meter sticks, rulers, and tape measures are great.  Also if you have whiteboards loose they can also be used as a straight edge.

Scaffolding:

I did the following two assignments the day before.  I had also done a vase design that began with a primary rectangle, so they had experience.

65CW Activity door design

65CW Activity scale drawing

More Student Work:

For The Absent Kids:

I got you covered!  Here’s a version of the activity that doesn’t need whiteboards.  This worksheet was the inspiration to this lesson and it was given to me by Dave Casey.  When I received it I thought to myself, “how can I make this great for a vnps classroom?”  I love editing existing lessons rather that creating them from scratch.

66CW MU Activity sideboard design


Cheers!

Origami Heart – A Geometry Lesson

I made this video / blog post because I remember wanting to do origami in class but being unsure how to connect it to content.  Until recent years – teaching math through art was pretty foreign to me.  But mostly with the help of Dave Casey I have been able to open up that portion of my curriculum and my students are better off because of it.

Origami lessons can be almost whatever you want them to be.  With each fold you can step back and ask questions, and take observations of the resulting geometry.  There are lots of bisectors, scaling of shapes, isosceles right triangles, trapezoids, kites, squares, and on and on and on.  Take this video as just one approach out of many.

As a rule I tend to ask the most questions during the first few folds and then pick up the speed as the folds get to the finish – but that’s not a rule or anything.  I also go back and forth on whether to have them unfold and observe the folding pattern that results.

This year I spent 35 minutes on this lesson.

Here’s the folding diagram for the heart – drawn by Dave:

The Extension:

Have students make a rectangle that is similar to 8.5″ by 11″ and then fold a heart with that rectangle.  Have them record the ratio and comment on the area differences.

The Goods:

CW Origami Heart


“Alone” Time In A Collaborative Classroom

I have three different “times” during my class this semester:

  1. VNPS.  Group work at whiteboards.  Groups of 2 or 3.
  2. Individual work.  Students are at their desks working on their own piece of paper, but they still collaborate.
  3. Alone time.  During alone time everyone puts on headphones or ear plugs and works alone.  No questions are allowed.  If they have a question they write it down on paper.  `

So what’s this “alone” time all about?  This semester I have been focused on a question:  What is the role of working alone in a collaborative environment?  If I focus that question a little more it would be:  Can we use music or silence to improve student perseverance, creativity, and mathematical understanding?  If I was to toss one more question in there:  How can we improve the transfer from what they can do at whiteboards in groups, to what they can do alone on paper?

During “alone” time every student either puts on headphones and listens to music or they put on ear plugs.  The students who listen to music are encouraged to find music that helps them concentrate.  The majority of my students are using Focus At Will for their music.   Focus at Will is a website that is designed to provide music that helps people concentrate for longer, and improve their creativity and perseverance during that time.  Although Focus At Will is a pay site, Spotify has free “focus” channels that work good too.  Focus At Will does offer advantages over Spotify but I’ll compare music options in a different post.

Here are the rules for “alone time”

  1. No talking, no questions.  If you have a question you need to write it down.  I generally break this rule if they raise their hand, but definitely no questions of peers.
  2. All students put on headphones or earplugs.  Amongst other things, these serve as physical barriers to communication.  There are no social pressures to communicate during these times.
  3. They do not have to finish whatever worksheet they are doing (if I’m going for procedural fluency).  They should relax and focus on understanding.  If they are expected to finish, they will rush.  And the need to finish will cause stress if they are unable to ask questions.
  4. I recommend Focus At Will if they use ear buds at this time, and remind them that it’s not about finding music you like – it’s about finding music (or ambient sounds) that help you concentrate and make you relaxed and creative.

I generally run “alone” time for about 5 to 15 minutes.  It depends on whether we are doing a procedural fluency type lesson, or a problem-based lesson.  Here’s my basic outline:

Procedural Fluency:

I show them how to do it.  They go to whiteboards and try it in groups.  Then they have “alone” time, and lastly individual time.

Problem-Based:

Sometimes I start with “alone” time so they can develop their own thoughts. Then they go to whiteboards, and end with alone time during the reflection.  Other times I do the opposite – begin and whiteboards and then have them go to alone time.

The Data:

After the first 3 weeks of implementing “alone” time – at about a frequency of once a class – I gave a quick survey.  The survey was a rating of 1 through 5 where I asked them to rank how helpful the “alone” time has been for them.  Here’s the scale:

1 – Negative effect.  You would be better off without “alone” time.

2 – Not helpful.  This is the “meh” answer.  You can take it or leave it.  It doesn’t help or hurt.

3 –  A little helpful.

4 – Helpful

5 – Very helpful.

Here are the results:

I have 3 preps this year and here are the breakdowns for each subject:

The above data was referencing “alone” time, rather than the idea of listening to music specifically.   I also asked the students if they had used Focus At Will outside of class.  Here were those results:

Over half of my students are using Focus At Will outside of the classroom now.

I’ll categorize some of their reasonings in a different post.  Students have found listening to music helpful, but also the other elements of “alone” time.  Multiple students commented in the survey that they loved the fact that they did not have to finish the worksheets during alone time.  They enjoyed be able to go at the pace of their learning.

Cheers!

-B

Update:

I didn’t mention that although Focus At Will is a pay site, I was able to give all my students a free one year subscription.

I forgot another important rule to “alone” time:  When I do need to cut in and talk to the class they are not required to take their headphones or ear plugs off.  Since the music is suppose to help them concentrate, then presumably it helps them listen to me as well.


Japanese Temple Geometry – Quick History

I am attaching the article that I use in class.  My students read parts of it before we start these problems.  I was just going to link to it but for some reason it is surprisingly hard to find online.  I’m glad I have a copy – here it is:

SangakuHistory.pdf

The author of the article – Tony Rothman – also has a book called “Sacred Mathematics: Japanese Temple Geometry” that covers Sangaku and can be found here:

http://press.princeton.edu/titles/8646.html

I will write about the pedagogy a different day – but if you are interested in these problems I wanted to share the article above.


Cheers!

-B

My Spiraling of Vroom Vroom

I titled this “My Spiraling of Vroom Vroom” because I highlight how I used this lesson to teach (introduce) line of best fit and statistics.  The original lesson uses line of best fit, but I also wanted to teach stats as well.

This would be the first time my students ever did a line of best fit and used it to make a prediction, and so I needed to add in some teaching around line of best fit.   I also wanted to use the pull back cars for a lesson on mode, median, range, and mean – so I used a different day 1 activity.  I’ll mention all the different “thinking” moments I cut out and where I implemented procedural fluency.  I got the activity from Fawn’s blog which you can see:  Vroom Vroom.  The difference between this post and Fawn’s is initial activity, as well as the need to bring in a Desmos activity builder since they had never used a trend line to make a prediction yet.

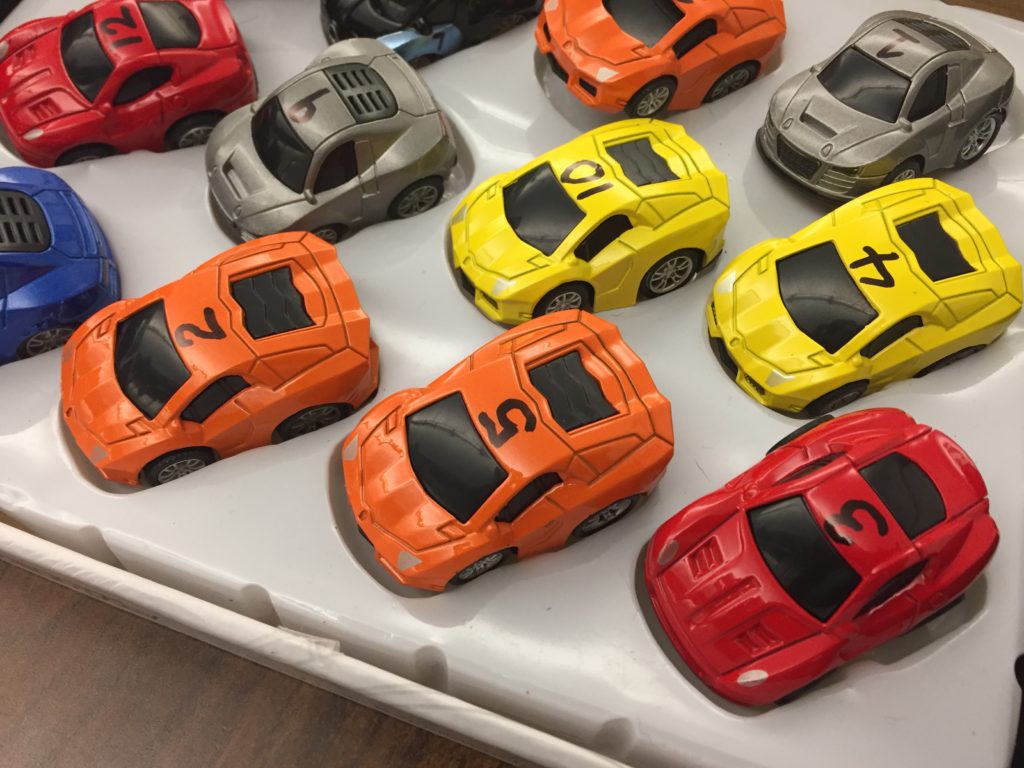
Pro tip:  This will go over several days, so if you have cars that look alike do not forget to number them!

IMG_5288

Vroom Vroom is a lesson using pull back cars from Fawn.  Check the link for her implementation.  The premise of her lesson is that kids get a pull back car and placed in a competition for who can get their car closet to the finish line.  At first they just get the car but do not know how far away the finish line is going to be and so collect data about how far the car travels from various pull back distances.  Then armed with just their data and regression, the are told how far away the finish line is going to be and they must decide how far they are going to pull back the car.  Closest wins.  I did do that same thing, but not until day 3.

My implementation is different because I also wanted to use it as a vehicle for an introduction to statistics.

Day 1: Collecting Data From A Single Distance

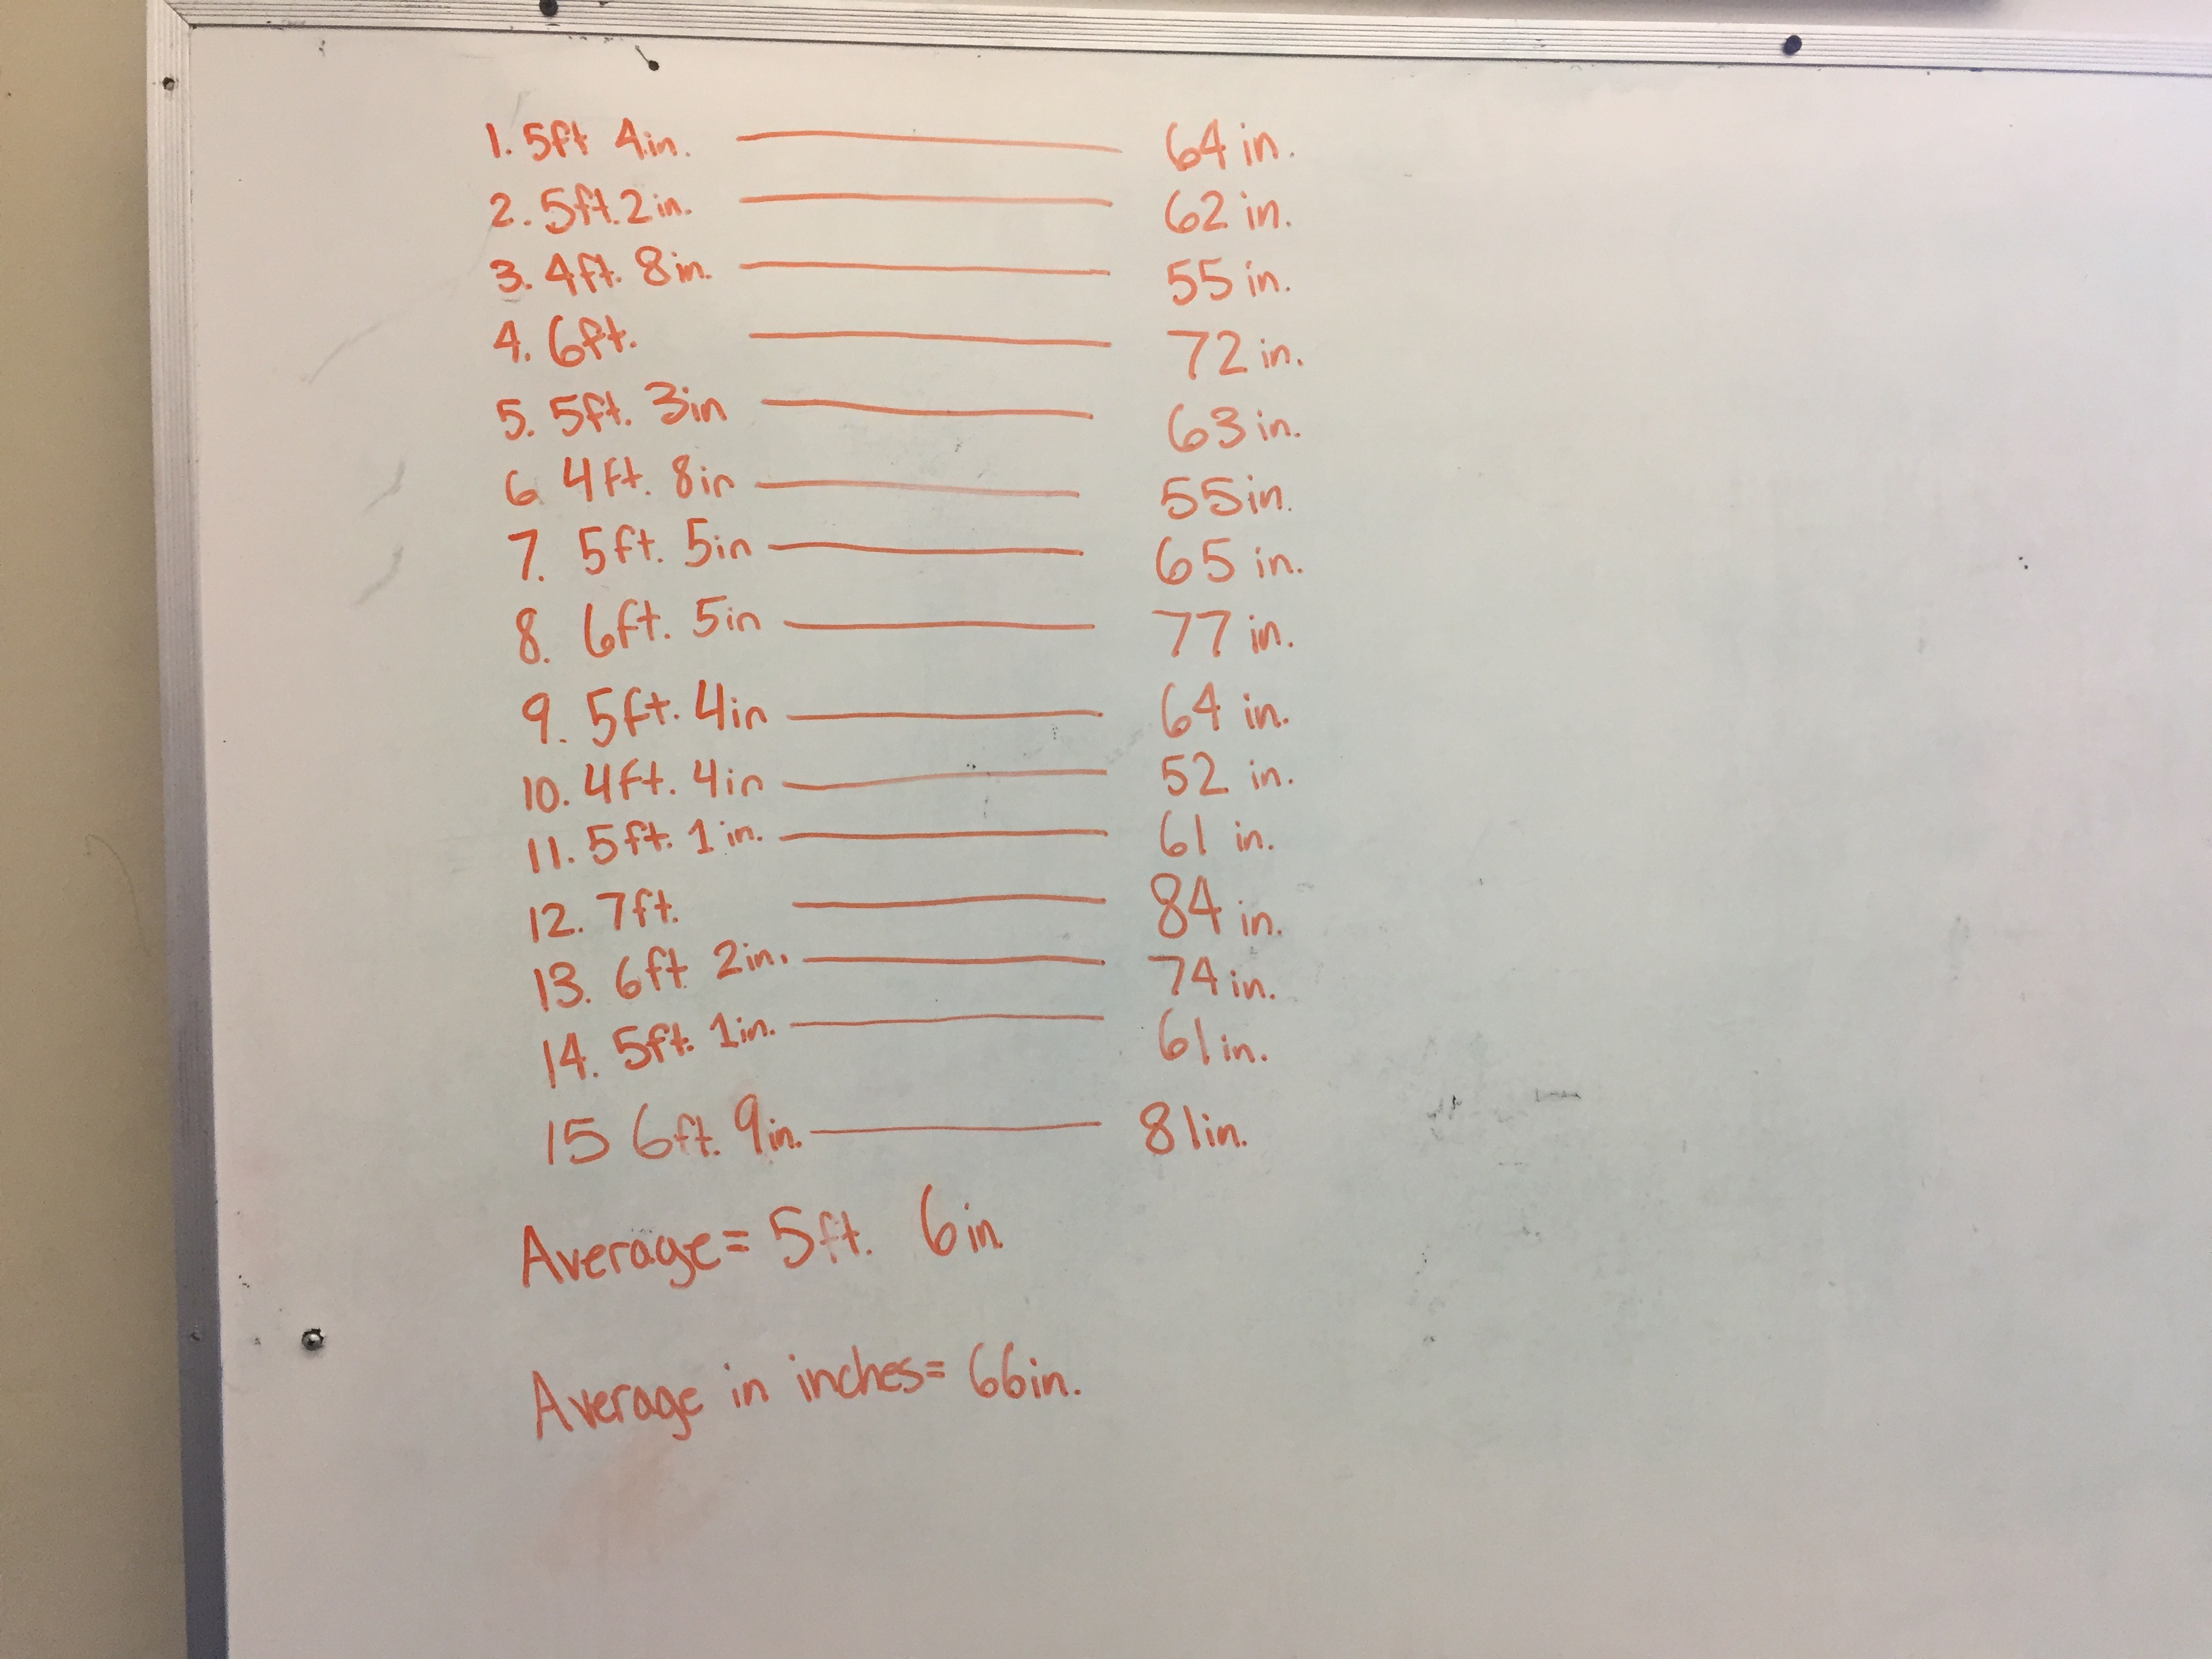
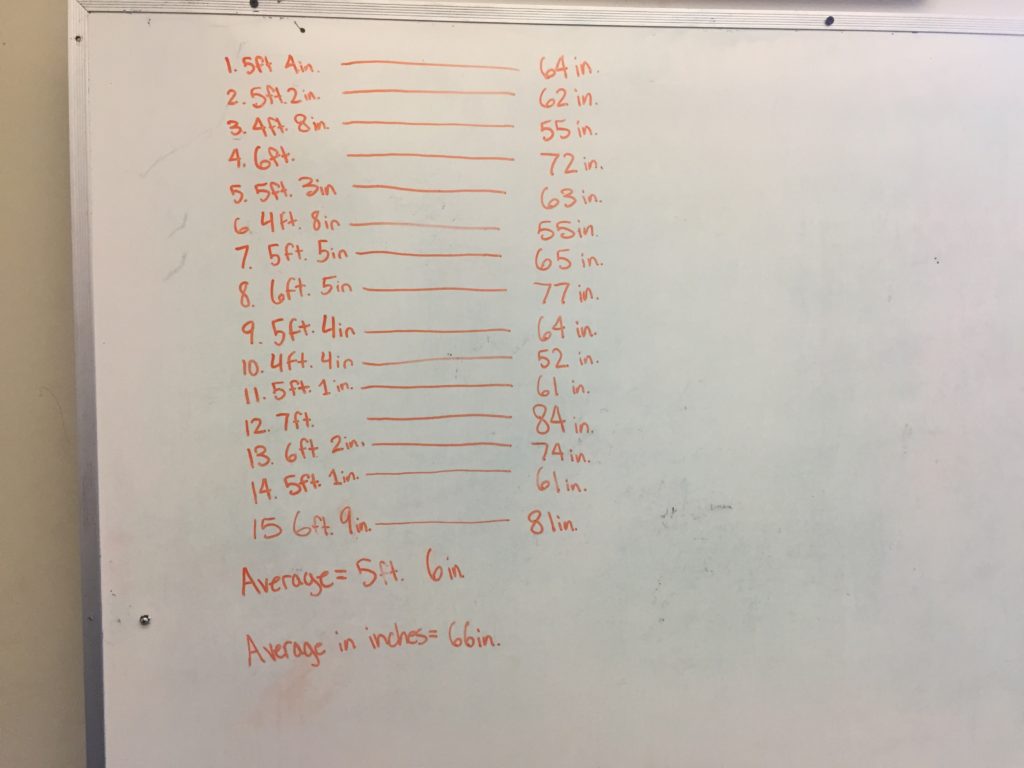
I told the kids that they (groups of 3) were going to get a pull back and I wanted them to take 15 measurements of how far the car travels when pulled back 5 inches.  I gave them time to discuss and decide if they needed any clarification.  These are the types of questions I got:

  • Do we measure from the starting line of from the release point?  (my answer was starting line)
  • What do we do if it doesn’t go straight?  (still measure how far it went.  Try your best to point it straight and if it doesn’t go perfectly straight then that’s just an attribute of your car)
  • When it’s done moving, do we measure it from the front of the car to the finish line? (yes)
  • Do we put the front wheels on the starting line or the front of the car?  (front of car)

Teacher Move I Needed:

  • After the first couple measurements I got the class’s attention and reminded them not always have the same person measure.  Learning how to measure the distances to the nearest quarter inch was one of learning goals and everyone should take turns doing it.  It seemed like each group had given themselves roles – pull back person, measure person, and recorder person.  I didn’t want that.

IMG_5287

IMG_5285

The reason I didn’t start with the competition was that I didn’t think they would have a natural sense of the variability of the cars performance.  By beginning this way I believe they will do a better job with the competition data collection.  We’ll see  tomorrow.

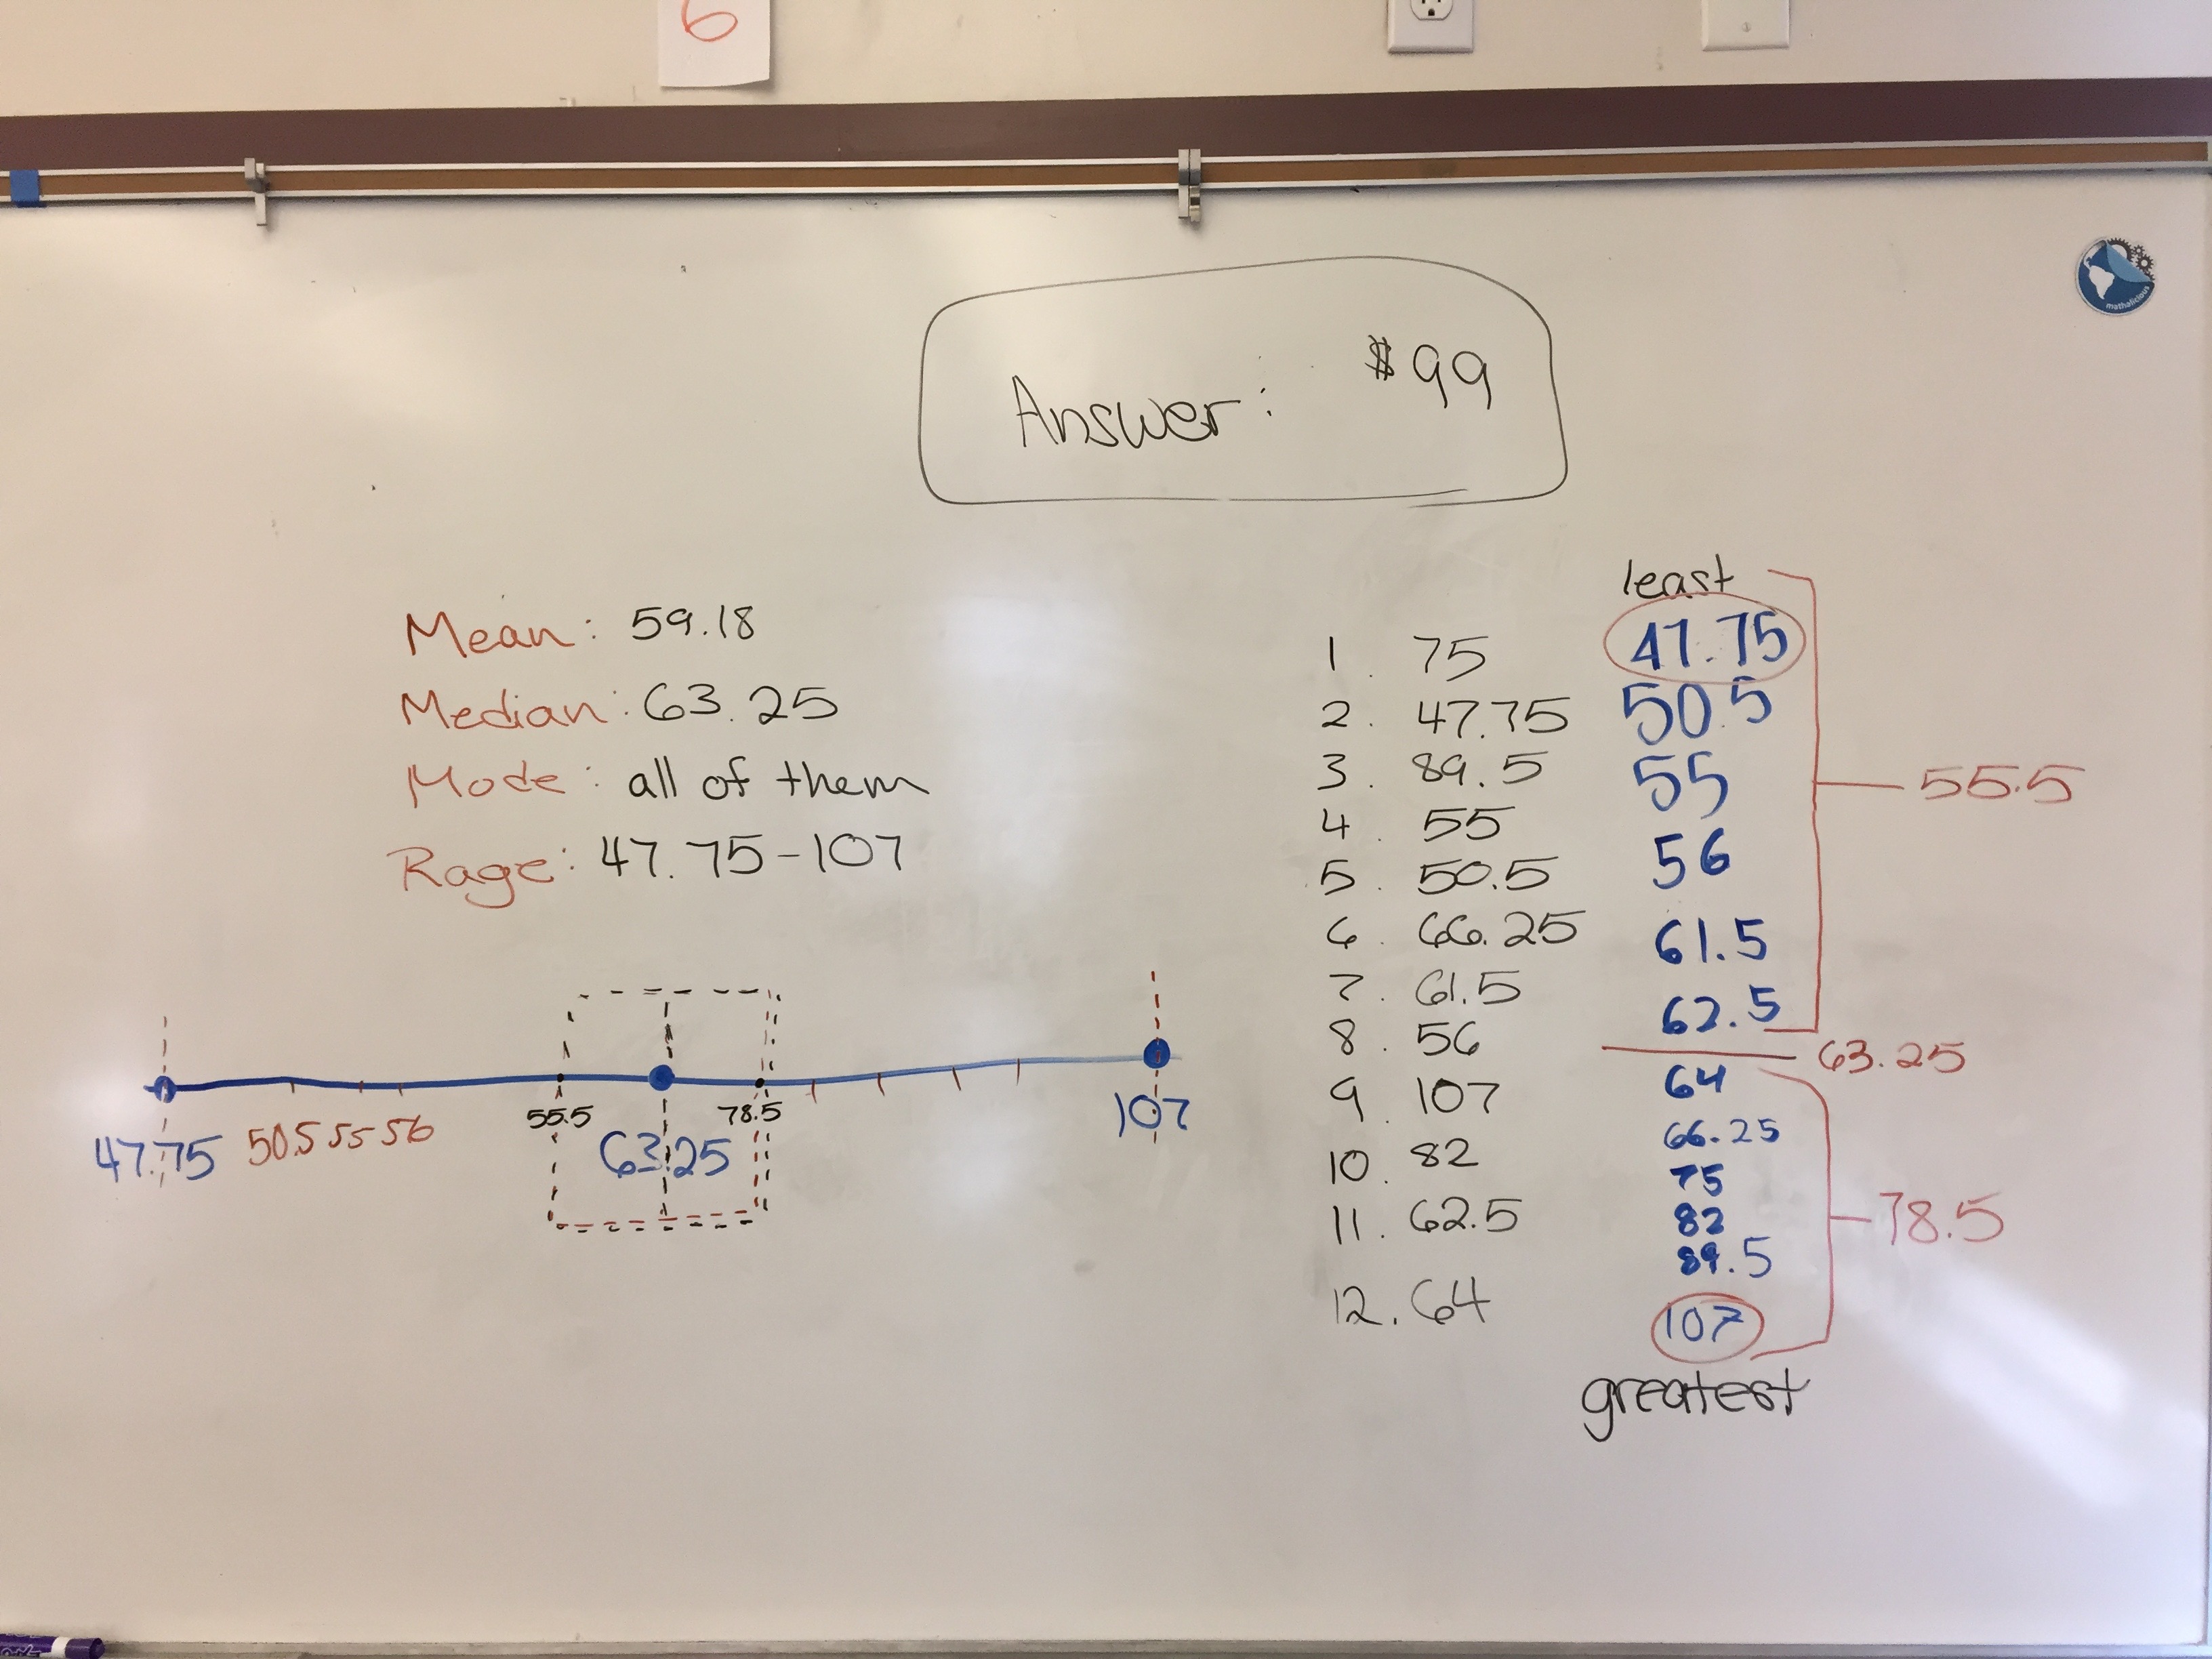
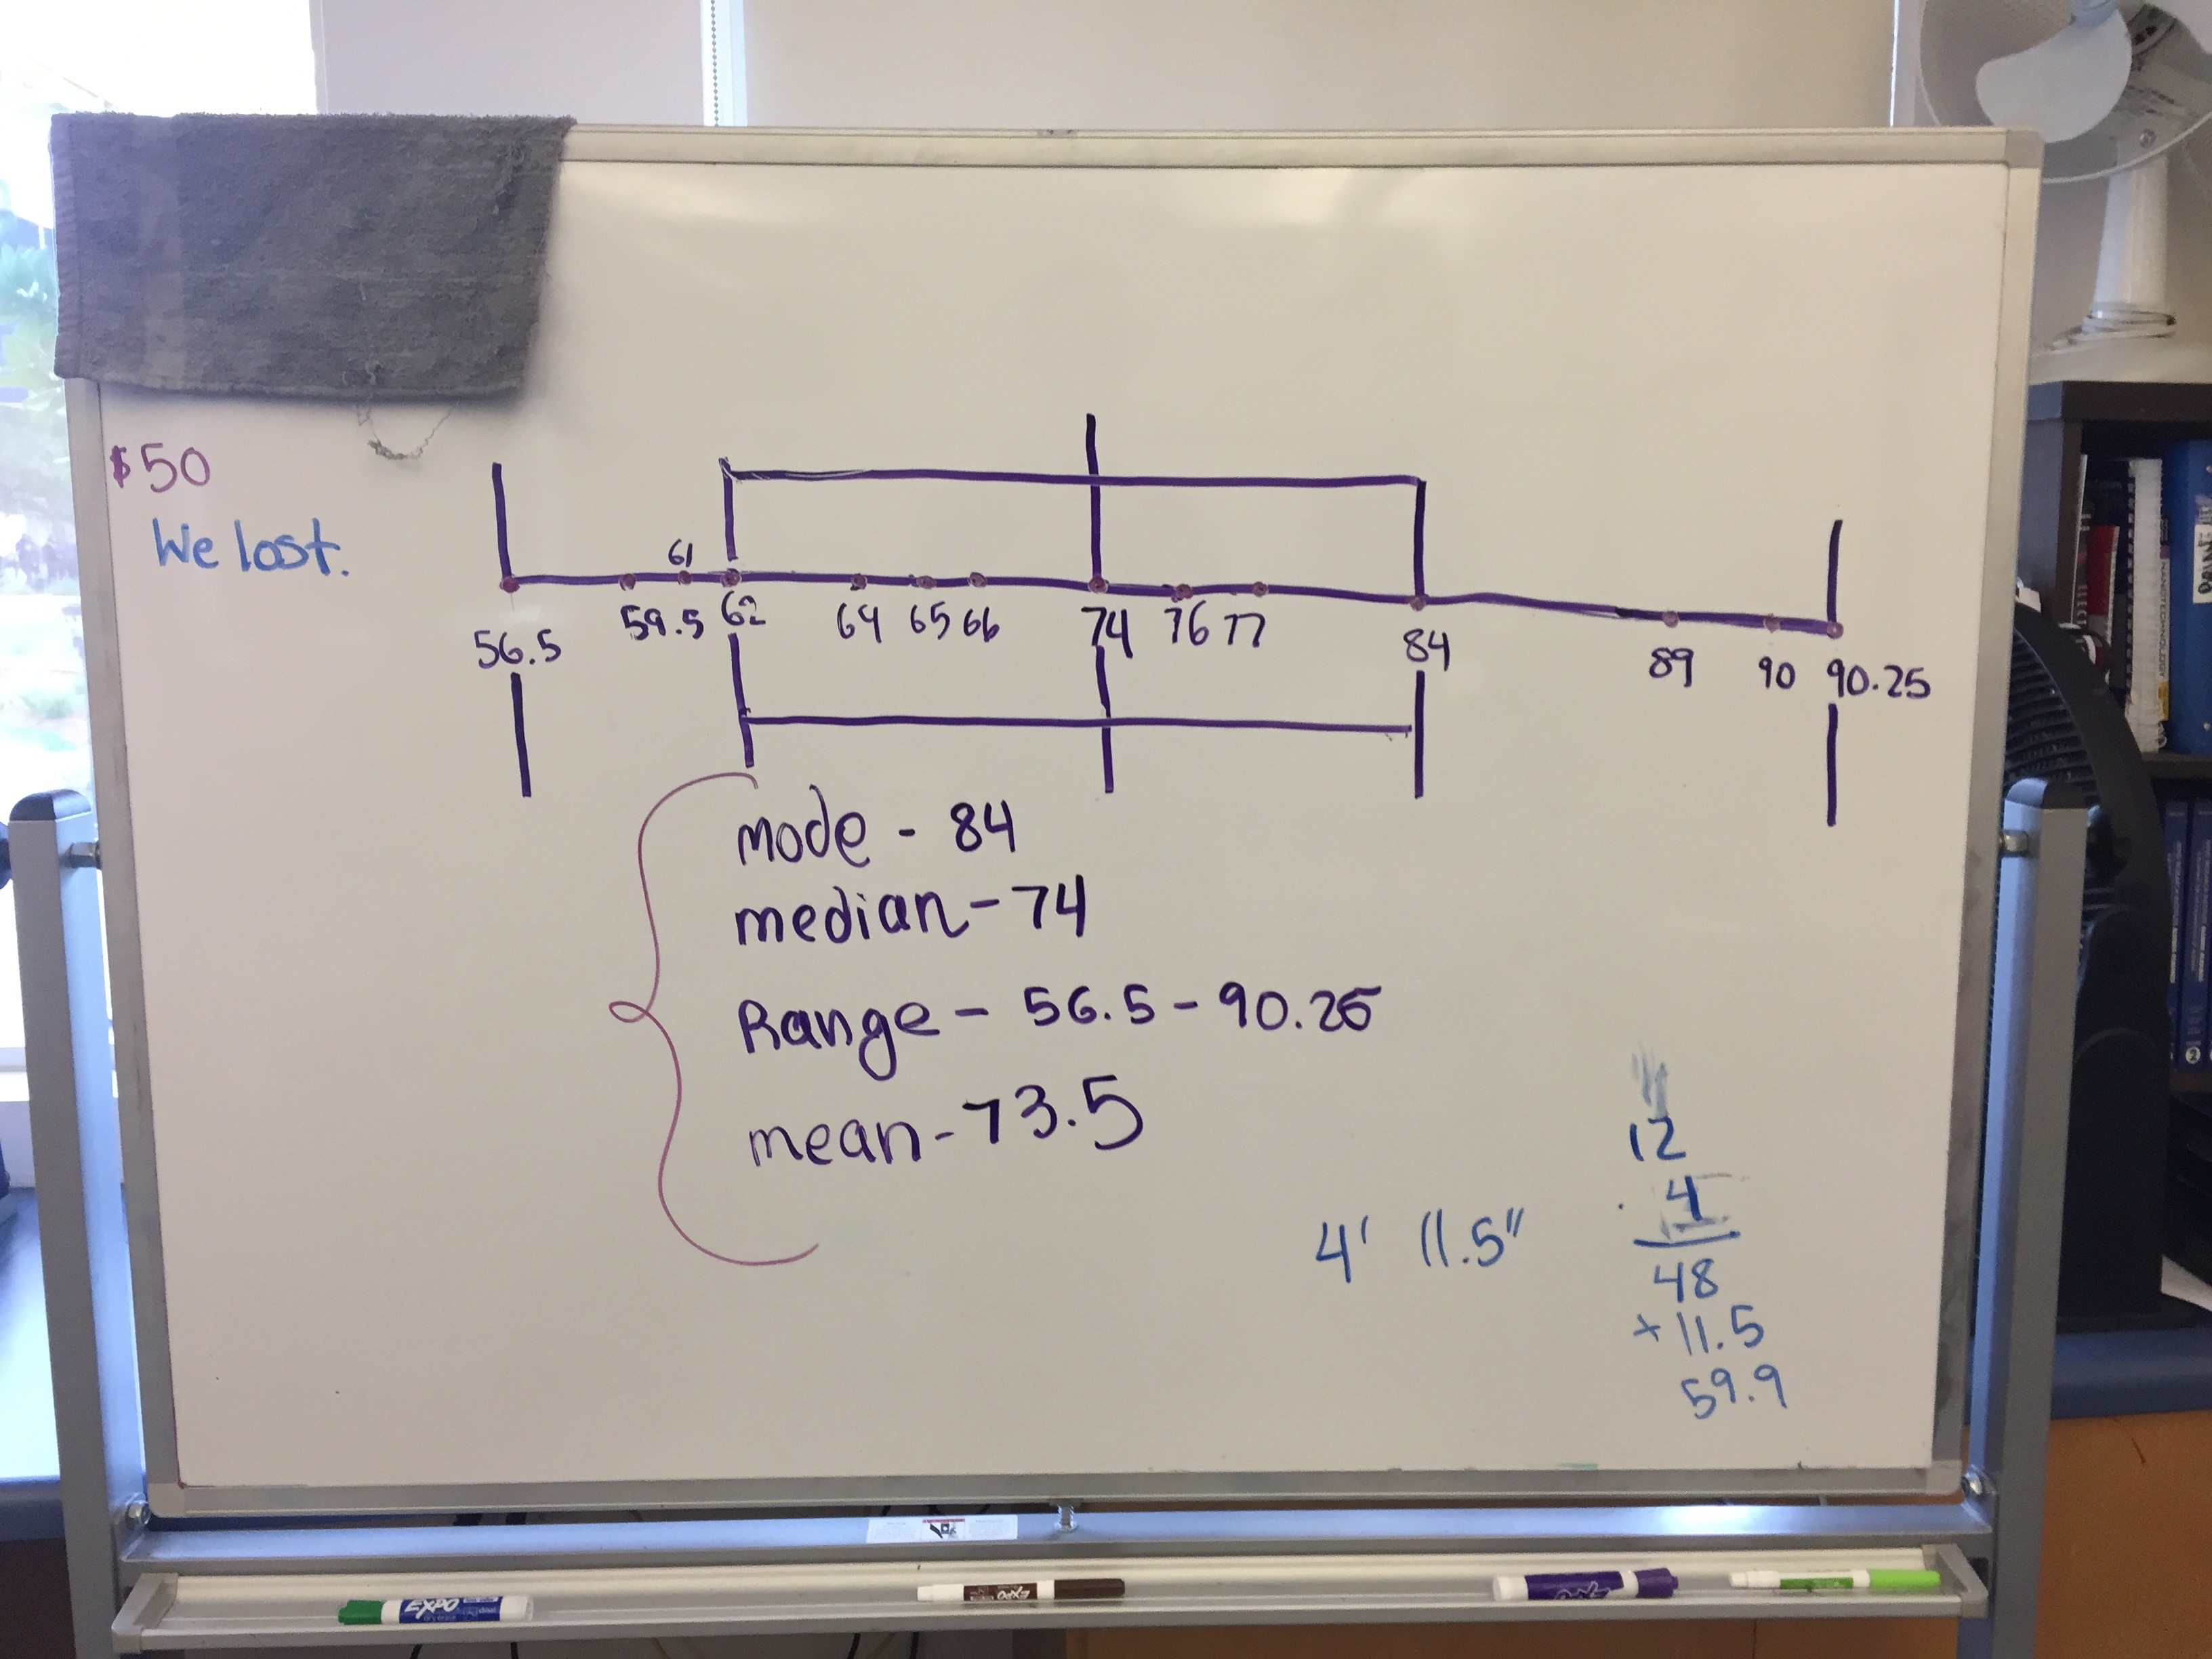
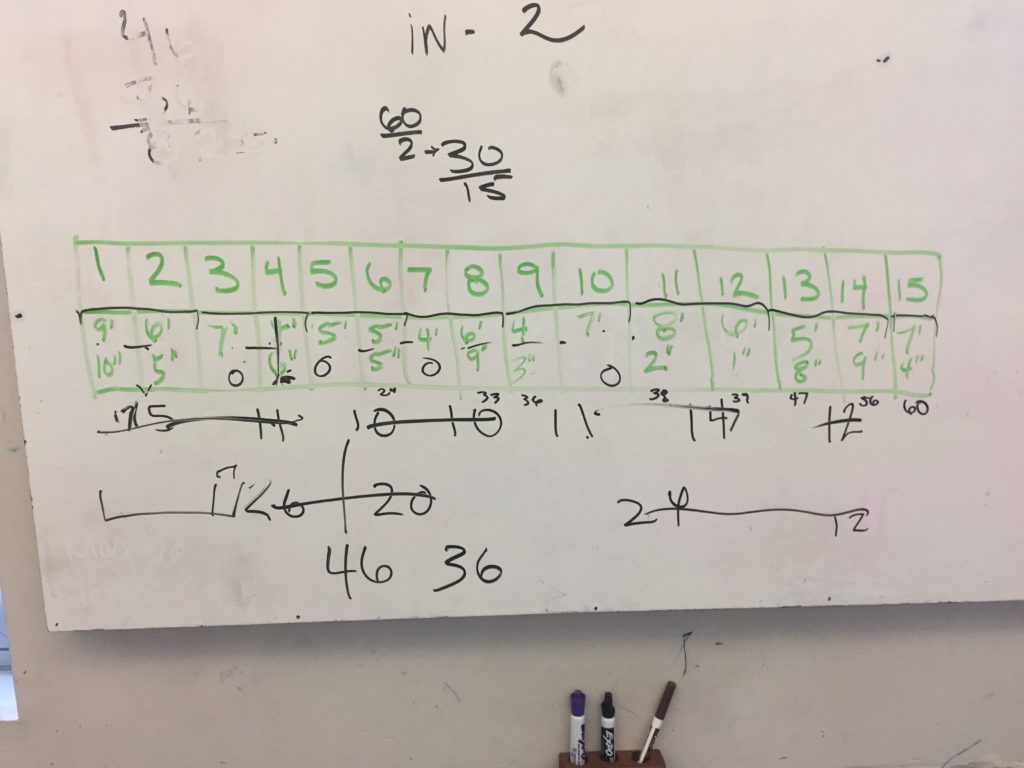
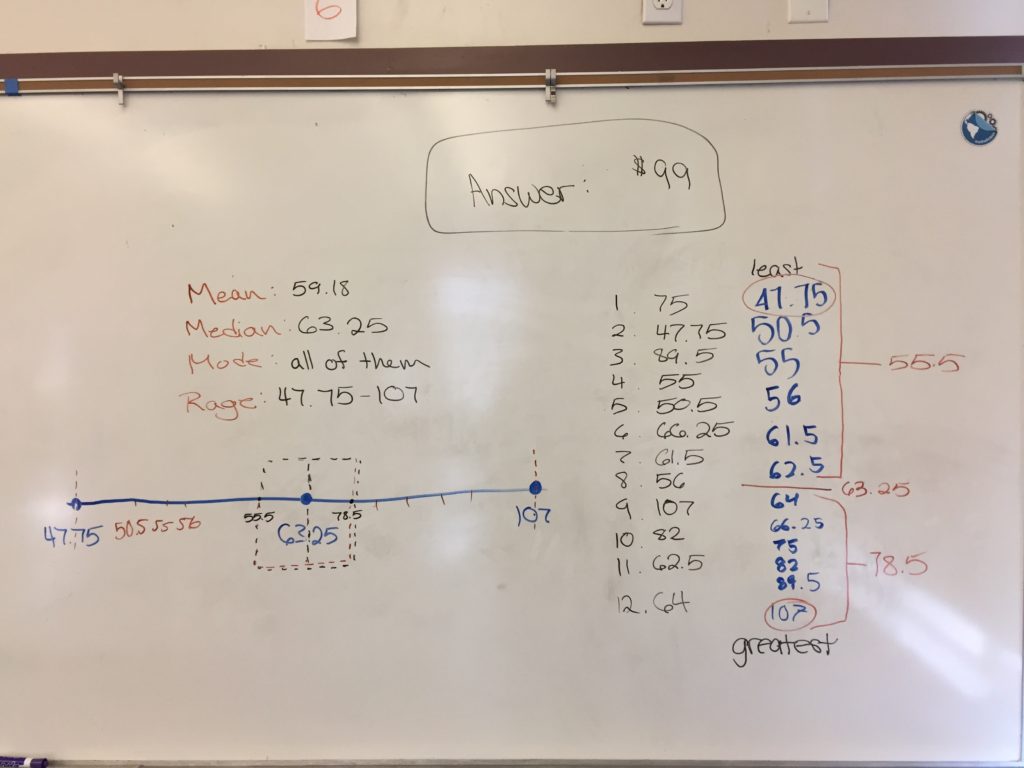
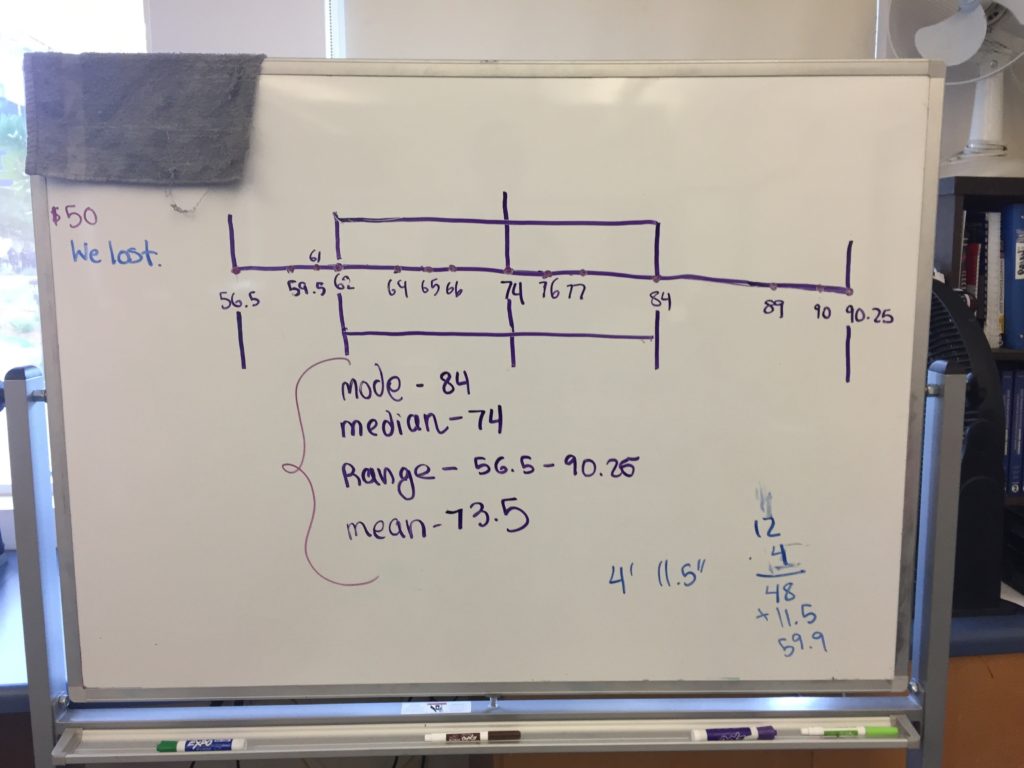
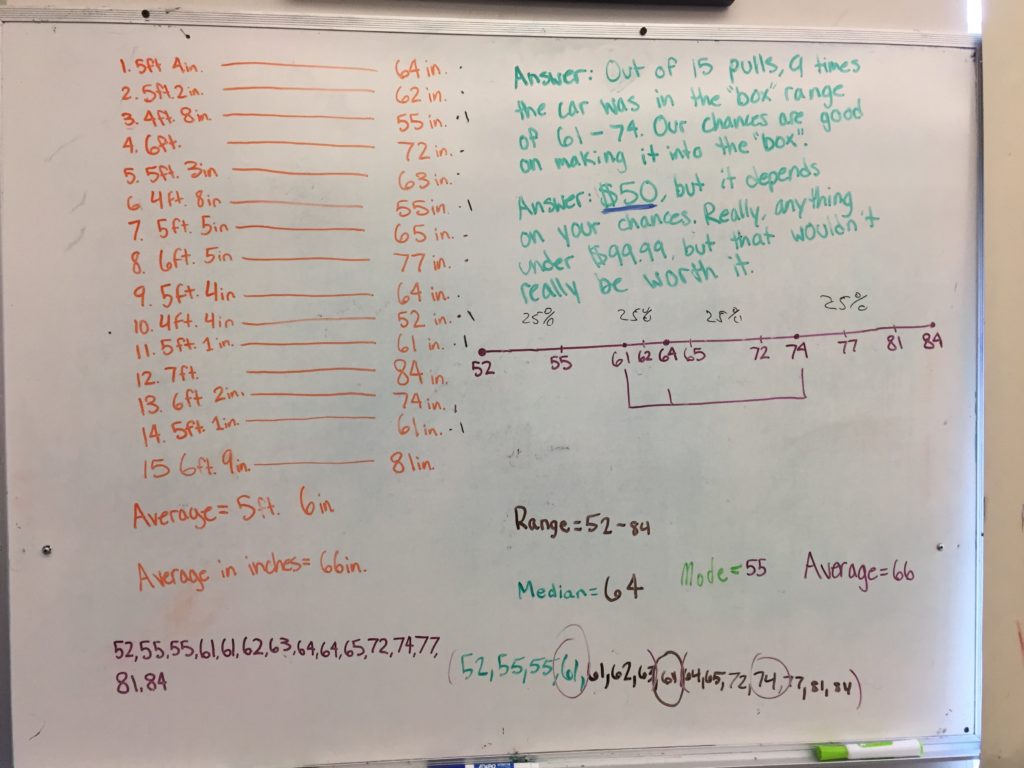
At this point I decided to give a mini lesson of how to find range, mean, median, and mode.  I showed them how to do it and gave them a worksheet for practice. Initially the students worked “alone” (told to put on headphones or ear plugs and no talking or questions)  When they were sufficiently far I had them go back to their whiteboards and find the mean, range, median, and mode of their data set and graph the numbers on the number line.

Then told them how to make a box plot of the data

IMG_5293

IMG_5294

IMG_5292

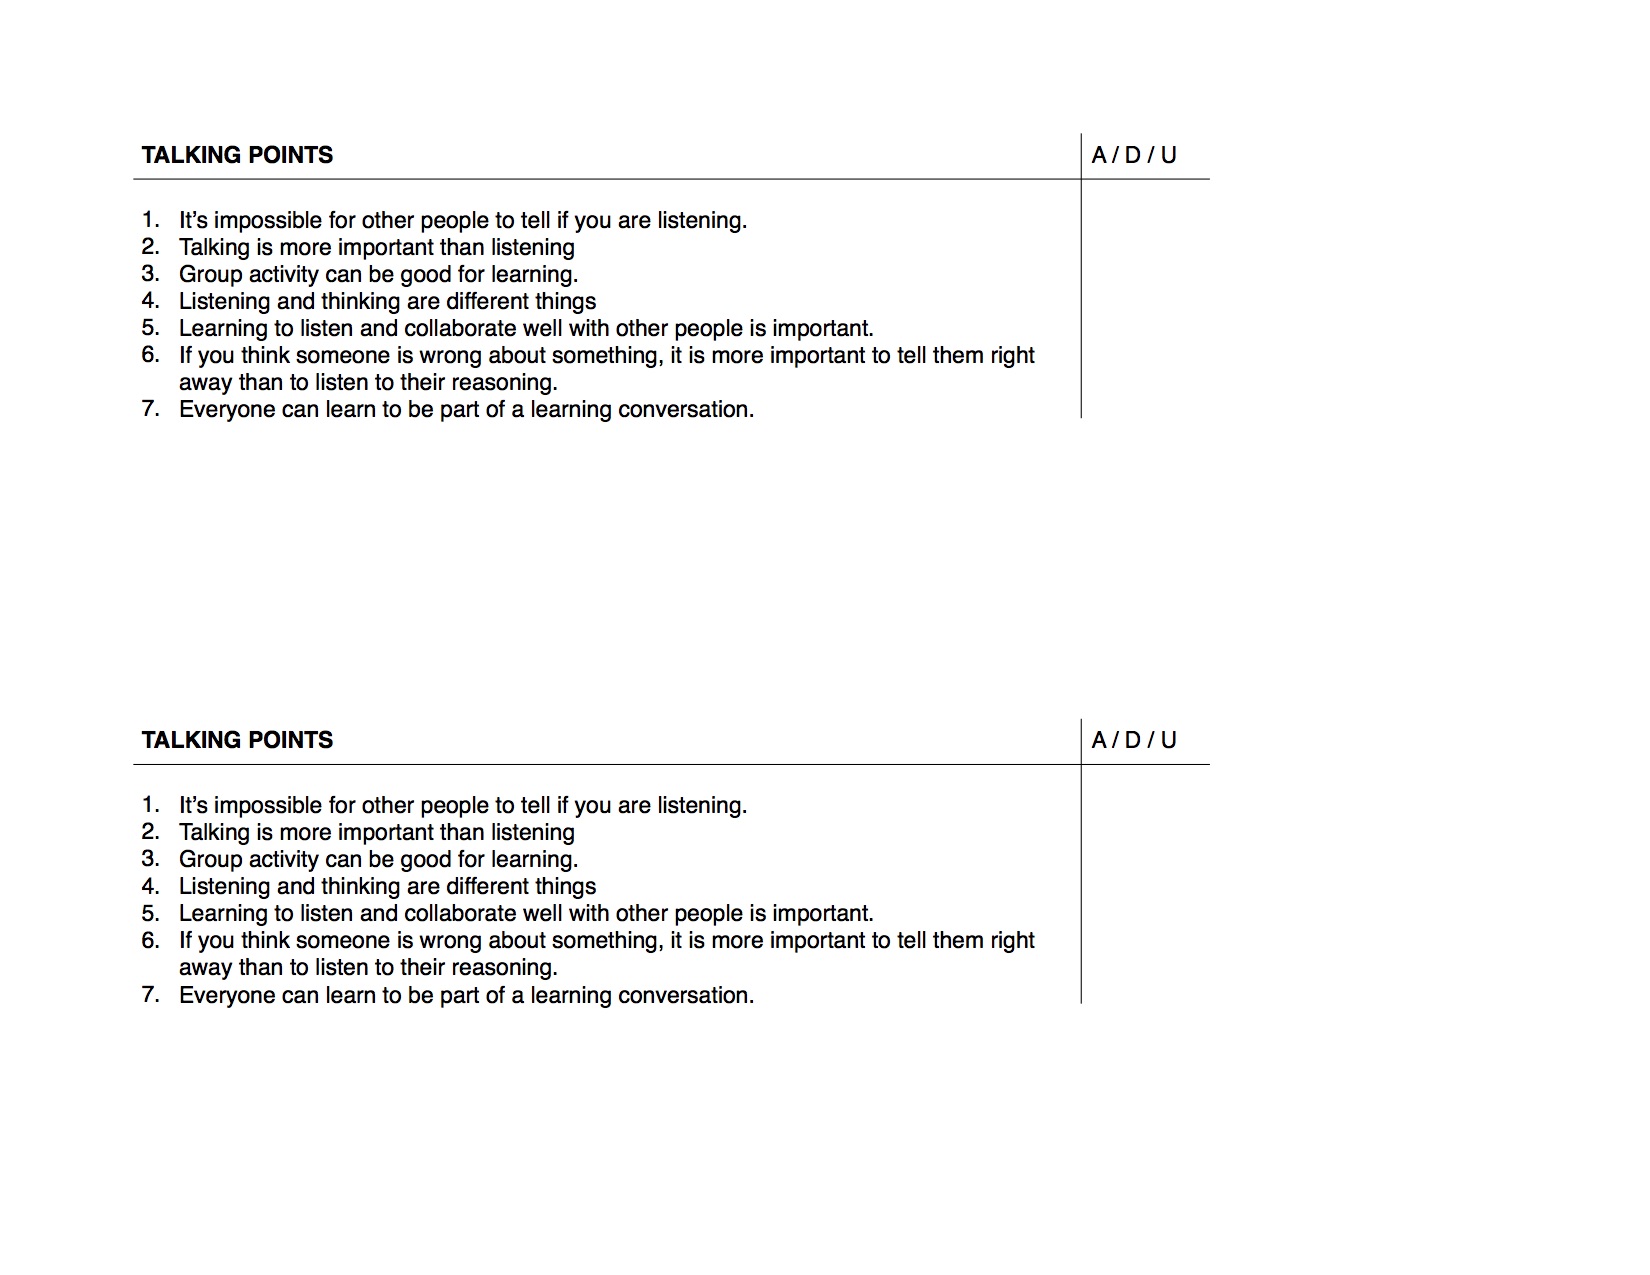
Thinking Questions: Here are some great questions to get the students thinking.  I always recommend teachers come up with these types of questions and turn them into “talking points” – it’s the best way I know to get everyone one record and discussing.

  • How confident are you that if you try it again the distance the car travels will be in the box?
  • If the prize for having the car end up in the box was $100, how much would you be willing to spend to play the game?
  • Is the mean or median the most appropriate measure to base our predictions on.
  • Let’s say you pulled the car back one more time and by some act of God it went 25000 inches.  What would your new mean and median be?

The final part of this day the students pull their car back one last time and see if it falls within their box.  I tell them to imagine they actually made the best, that money was on the line.  Once back to their seats we reflected on the activity and possible sources of error.

I should add that during the reflection I asked them how confident they would have been if I said the car had to travel anywhere between 0ft and 300ft.  They were 100% confident.  I used that to tell them informally about the 95% confidence interval.

Day 2 The Competition Begins

Today I tell them that they are in a competition.  Which ever group gets closest to the finish line wins.  They get 20 minutes with their car.  The catch is that they don’t know where the finish line is going to be until after the 20 minutes.  At which point they need to decide how far they are going to pull back their car to achieve the proper distance.  One chance.

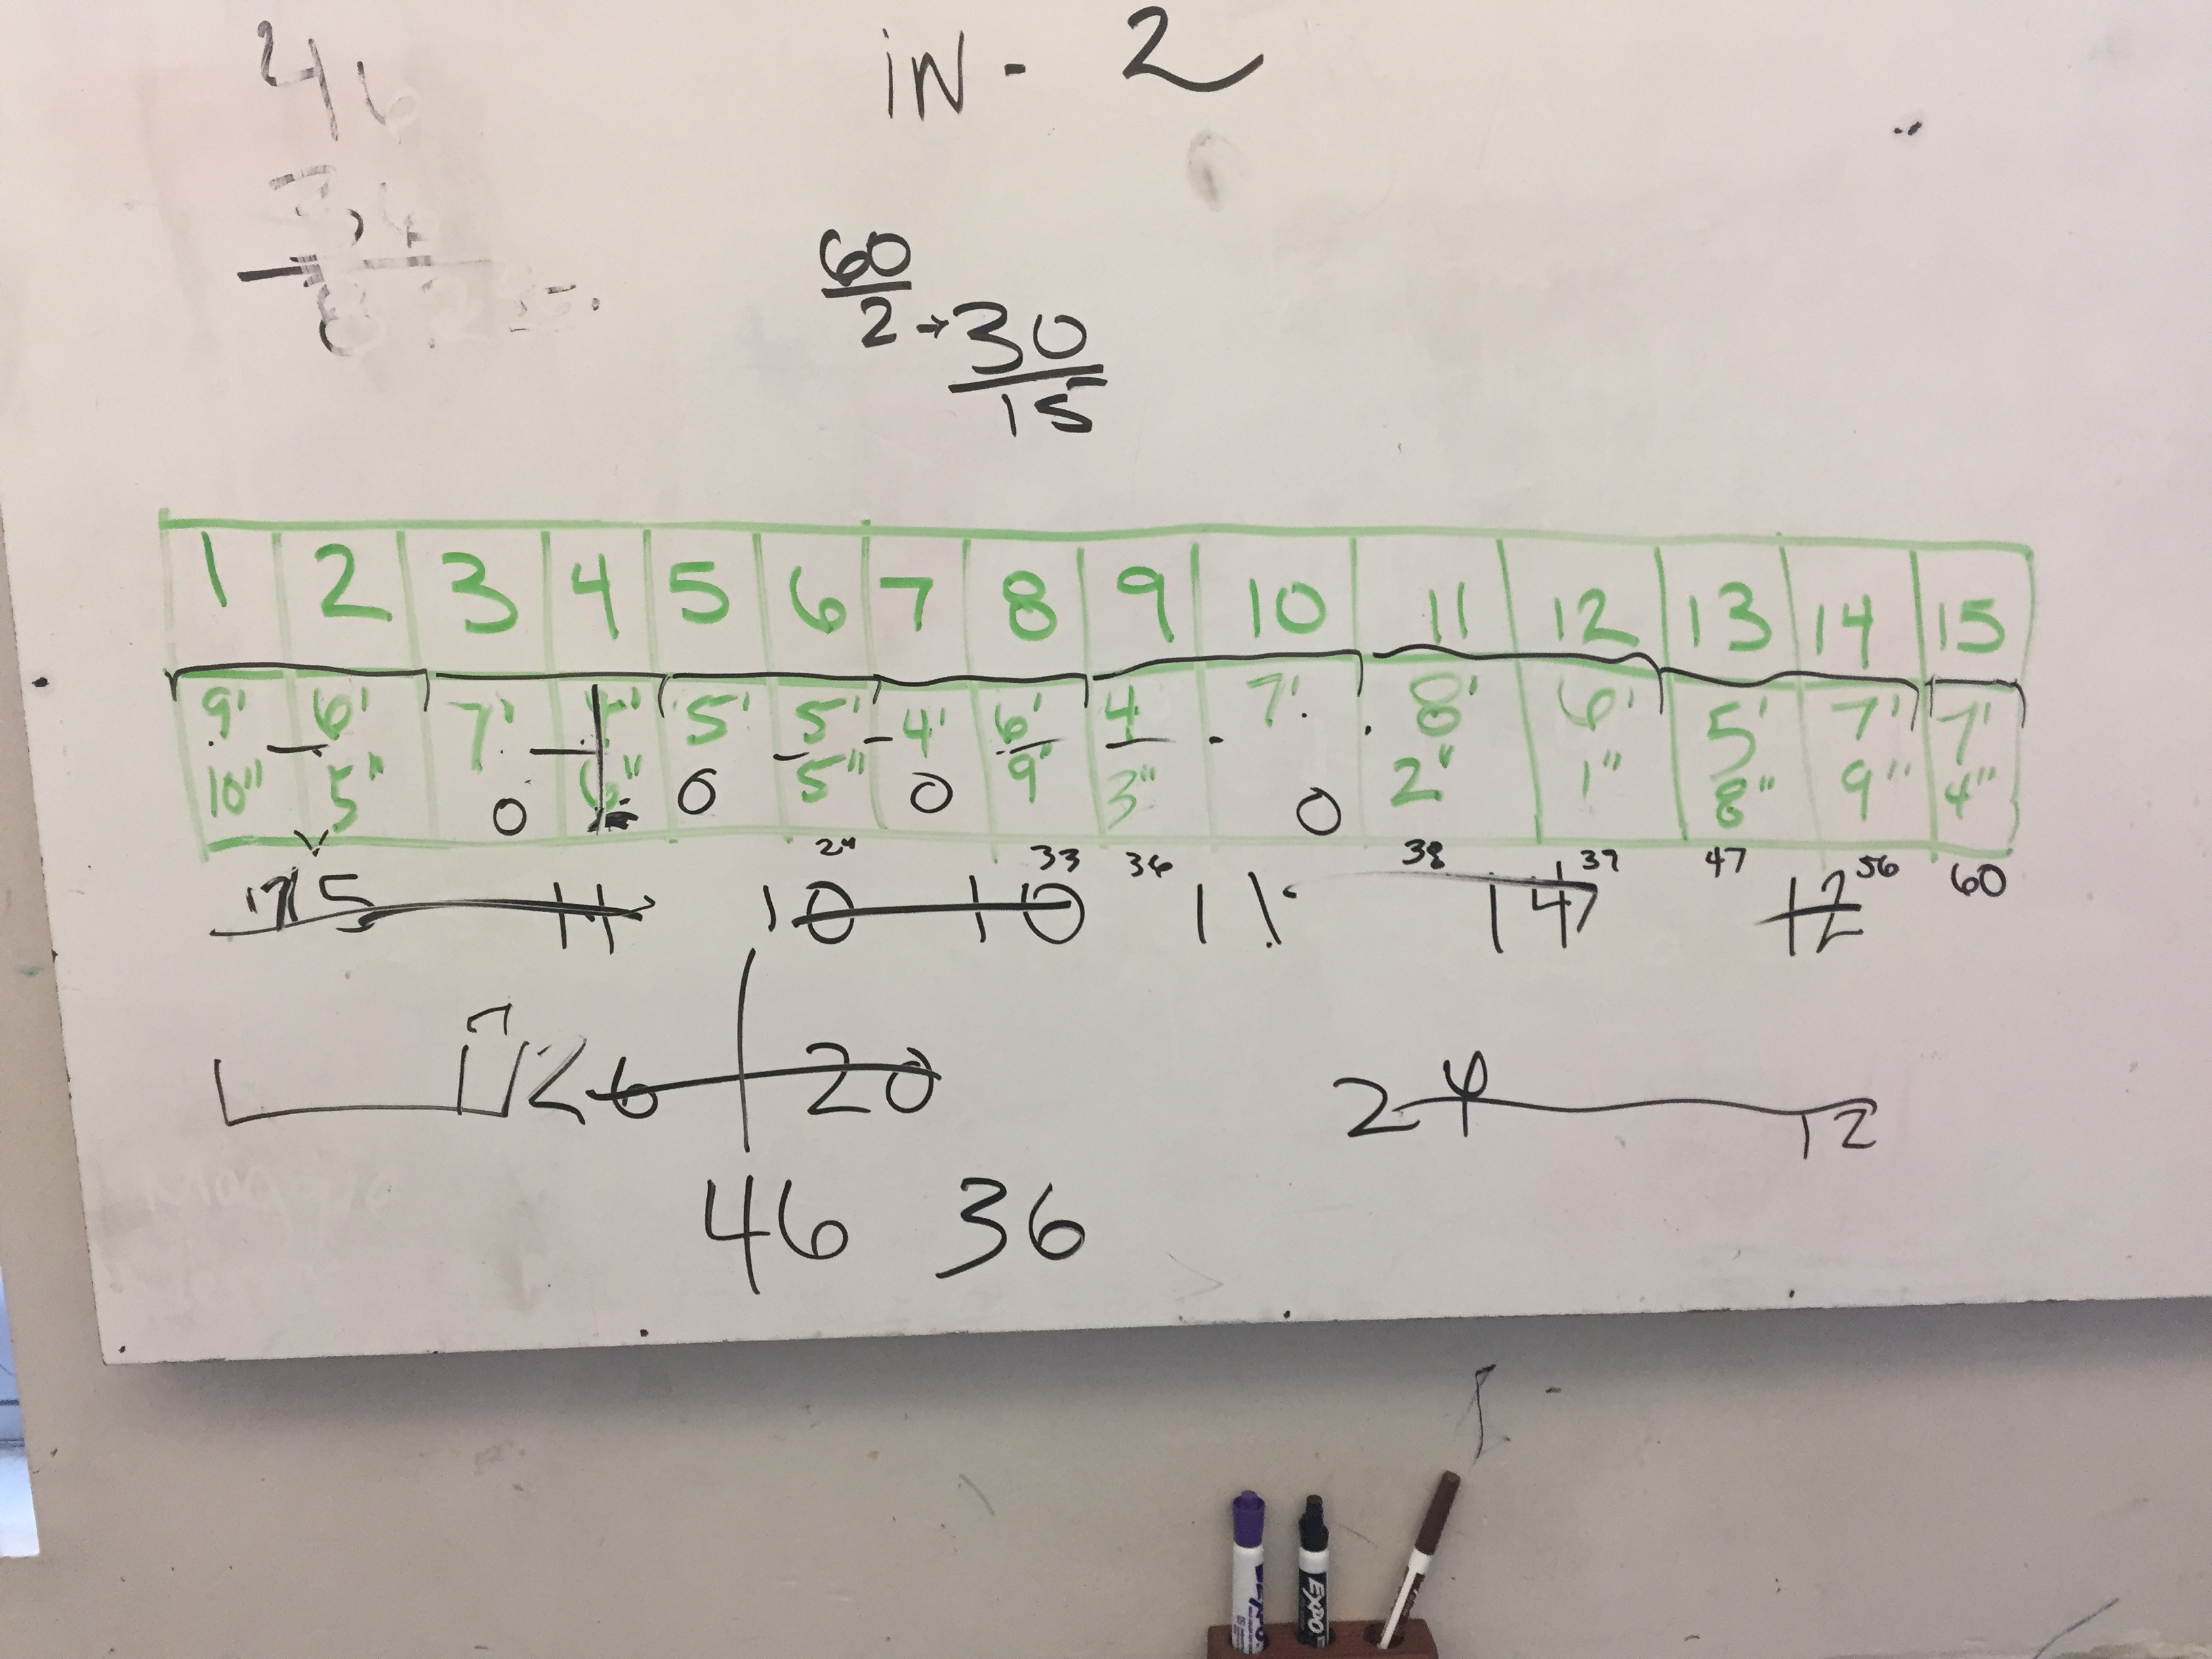
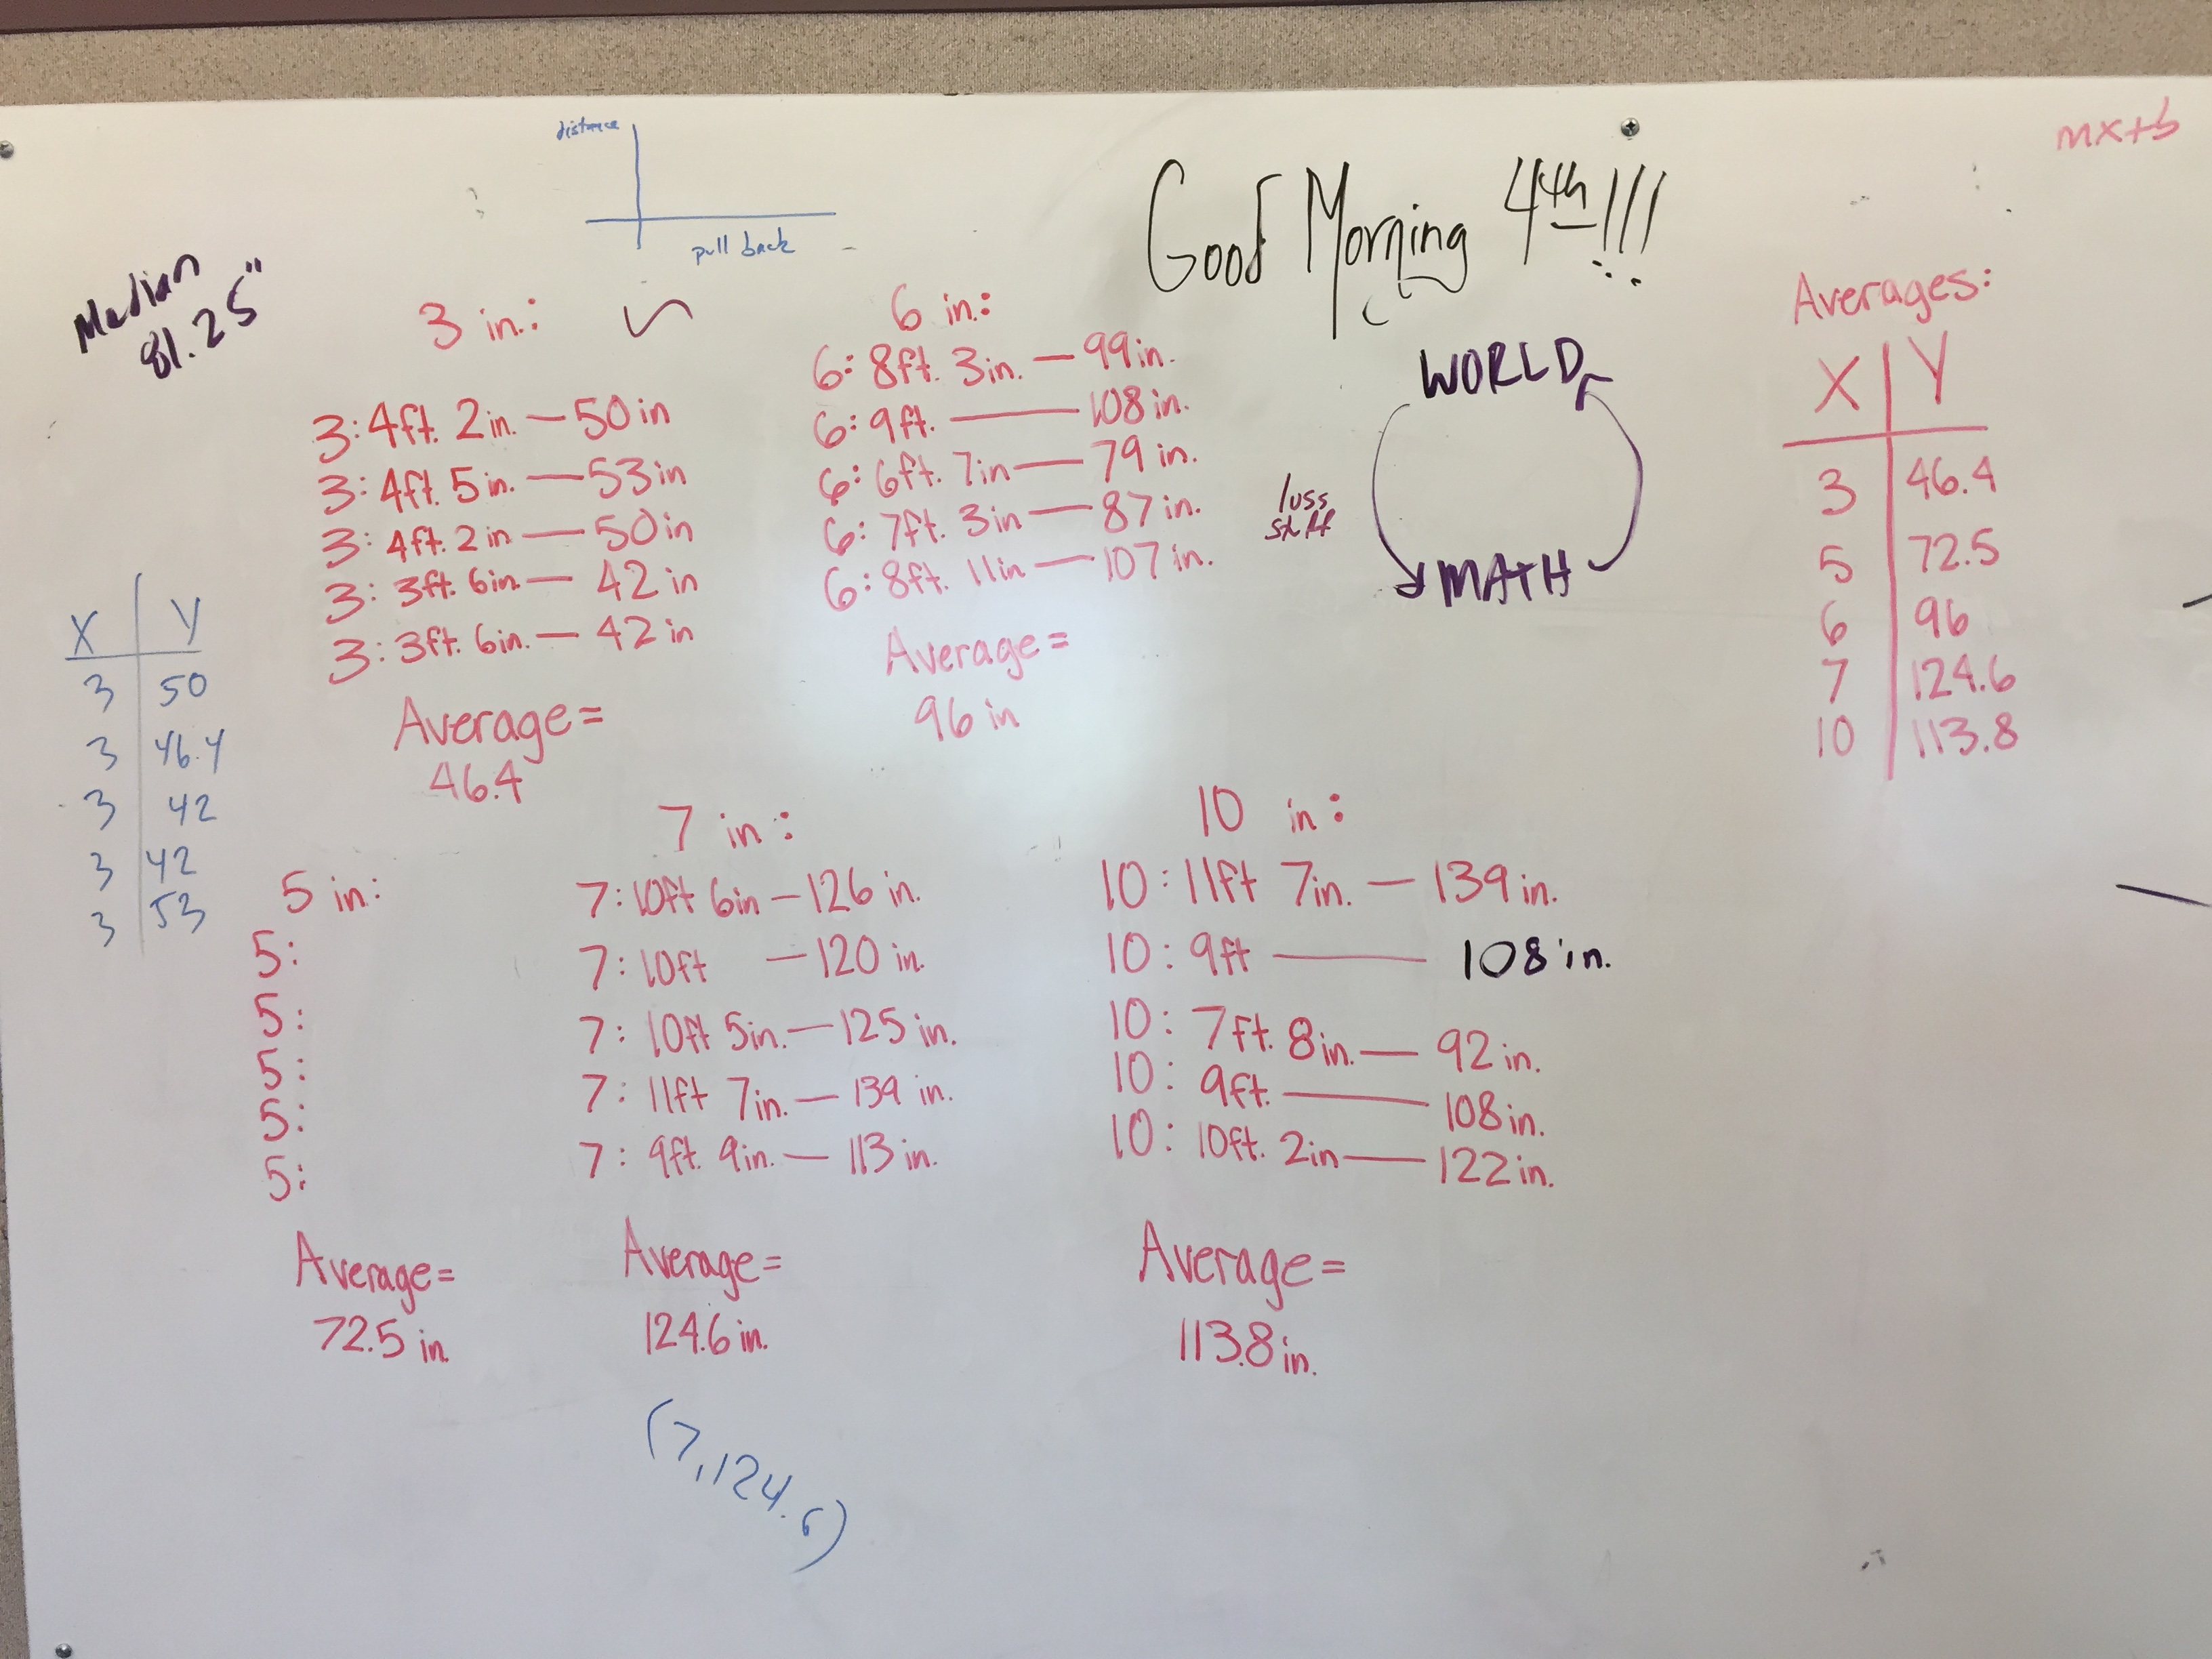
I gave them 2 minutes at the beginning to write up some thoughts on what they are going to do once they have the car.  I was able to learn that some students were planning to pull it back as far as it would go.  They had not connected to the activity and thought they were suppose to make the car go back as far as possible.  Here’s some of the data that was collected:

IMG_5312

IMG_5313

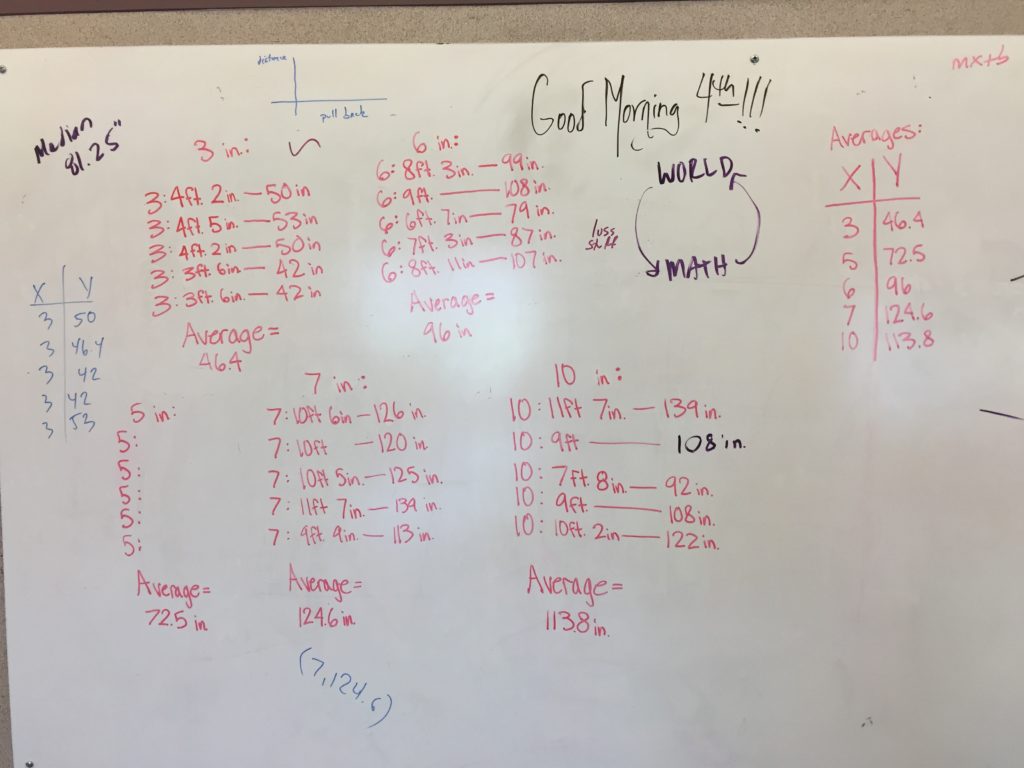
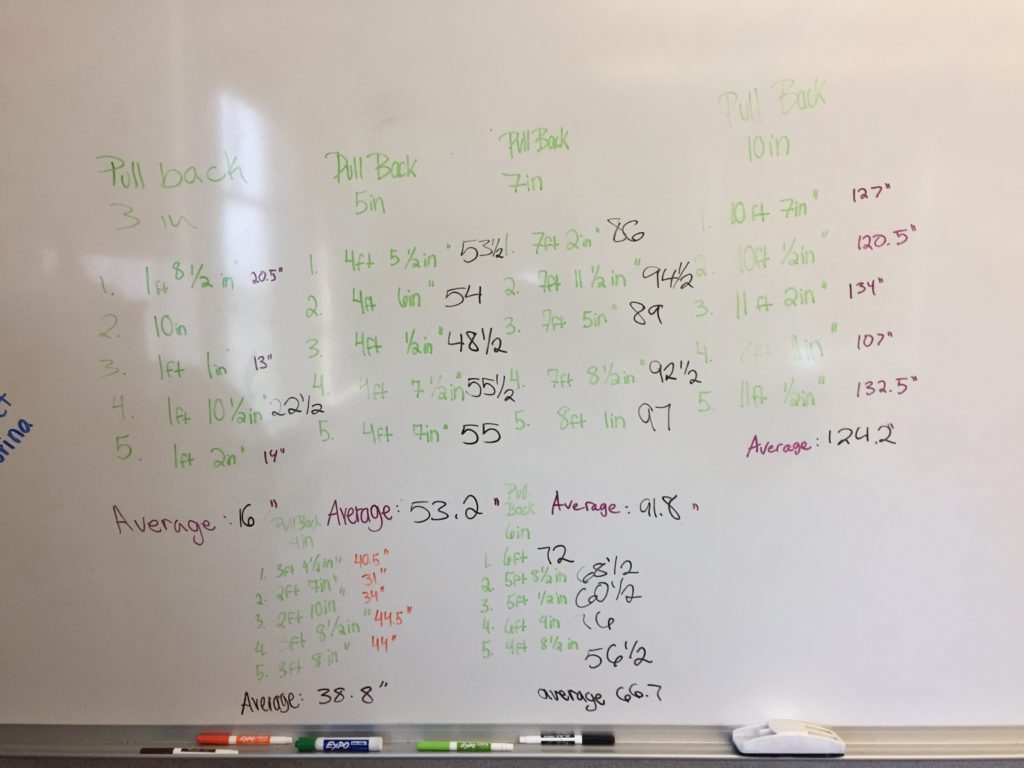
As teams began to finish I had them begin to enter their data into Desmos.  Then I collected the cars and told them the distance was 5′ and they had to come up with a pull back distance.

Day 2 Line Of Best Fit Procedural Fluency

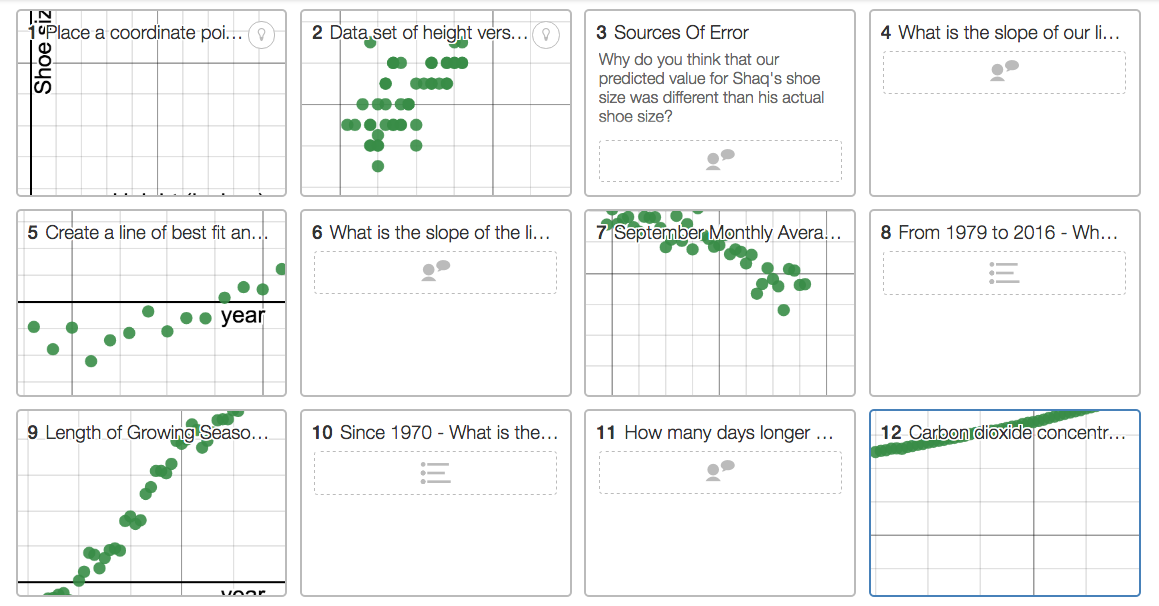
This lesson marked the first time my students used a line of best fit, so I didn’t feel they would be able to use it to help them make their predictions yet.  I decided to scaffold that by created an activity in Desmos activity builder.  I walked them through the first 3 screens, and they finished it on their own.  Then I had them go back and use their new skill to help them make another prediction for the pull back distance.  They would be able to test both distances.

Here’s the link to my activity:

https://teacher.desmos.com/activitybuilder/custom/58766a9dd249218510eee439

I used real-world climate data off the EPA’s website.  I wanted to have this learning segment to be a conversation that mattered and top of being fun and playing with pull-back cars.

After the students finished the line of best fit Desmos activity I had them use their new skill on the data they collected from the previous day.  They each did a line of best fit and got their second estimation for the pull back length.

Day 3 

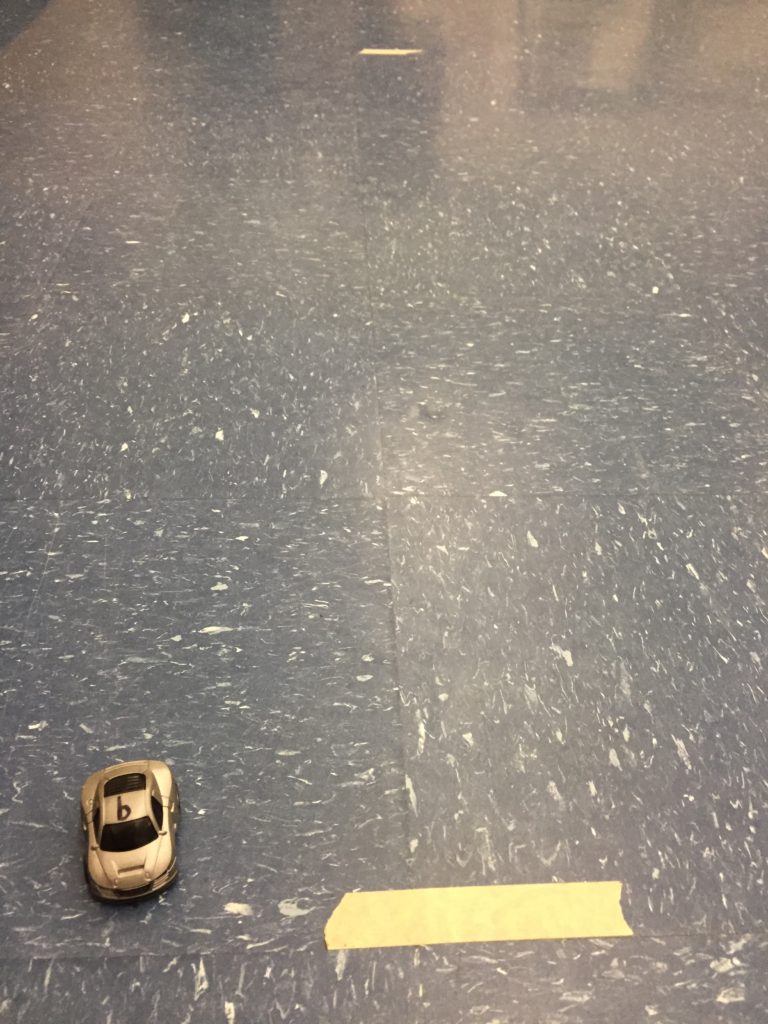
With their estimations in hand – we setup the track and did the competition.  The champ got pretty close.

Day 4

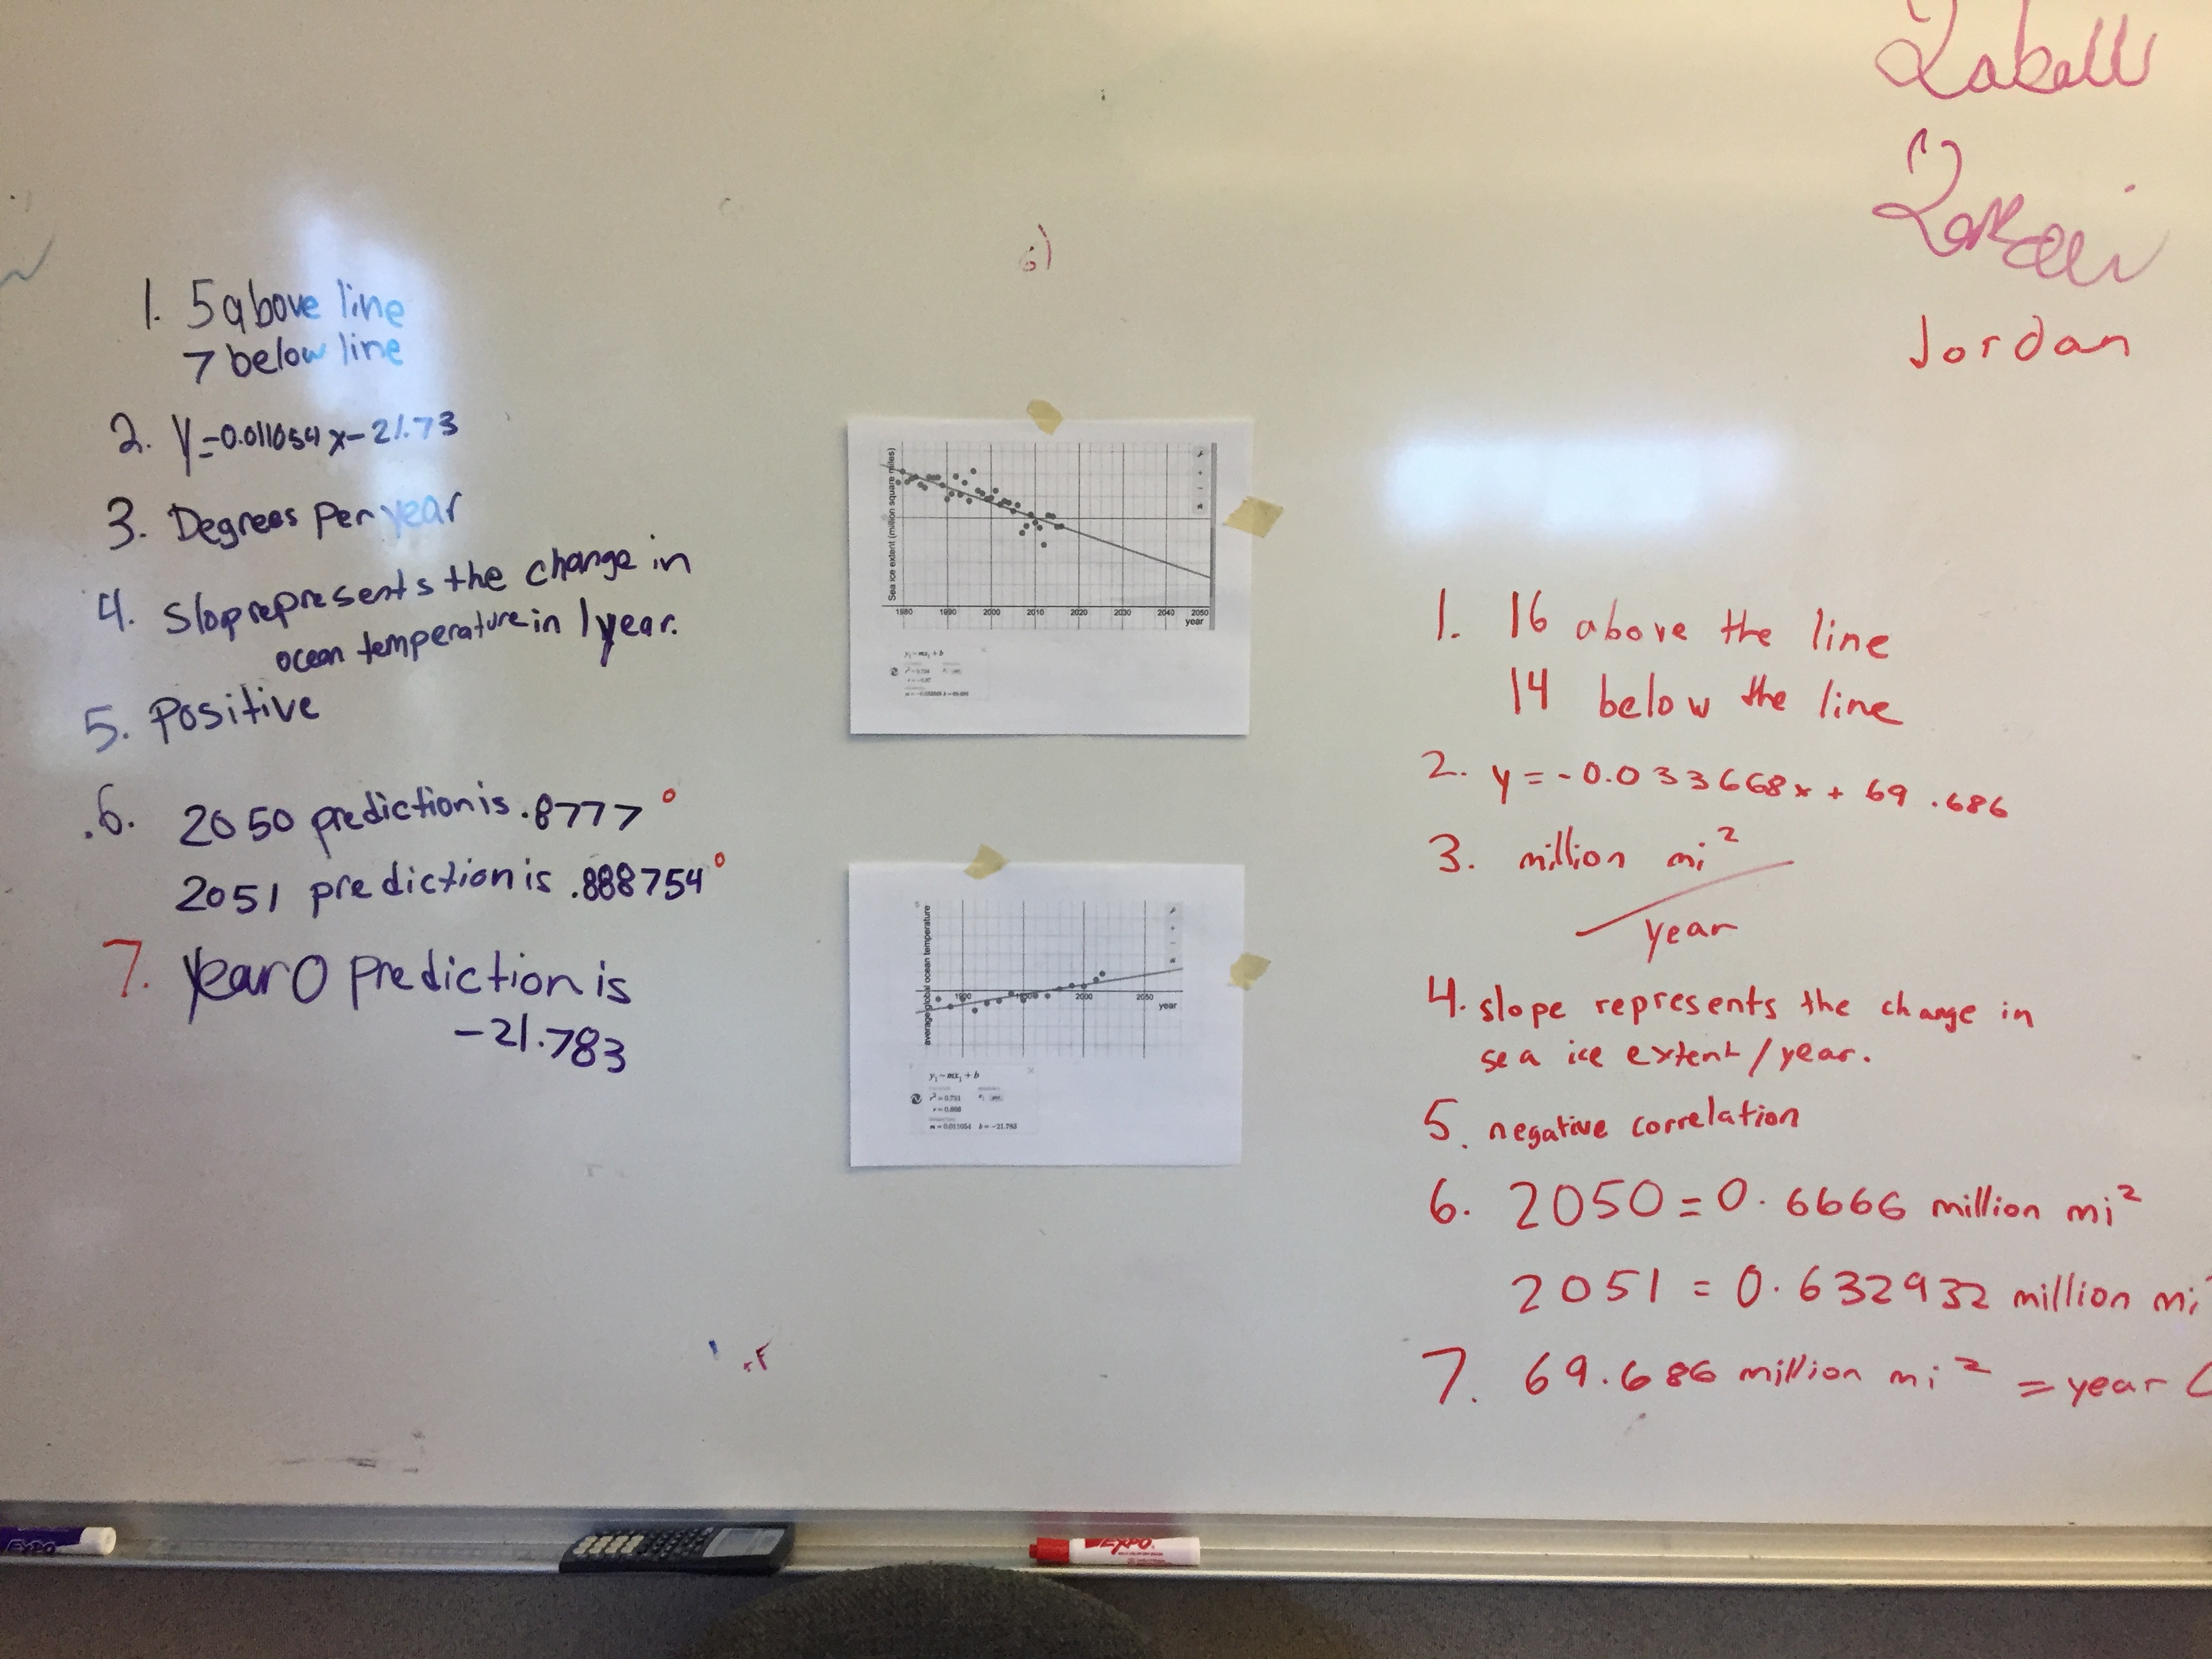
I didn’t plan on this day, but the Desmos activity highlighted that the students where unable to describe what the slope of the line of best fit meant in the context of the question.  So I handed out two of the graphs from the Desmos activity and taped them to whiteboards and asked the following questions:

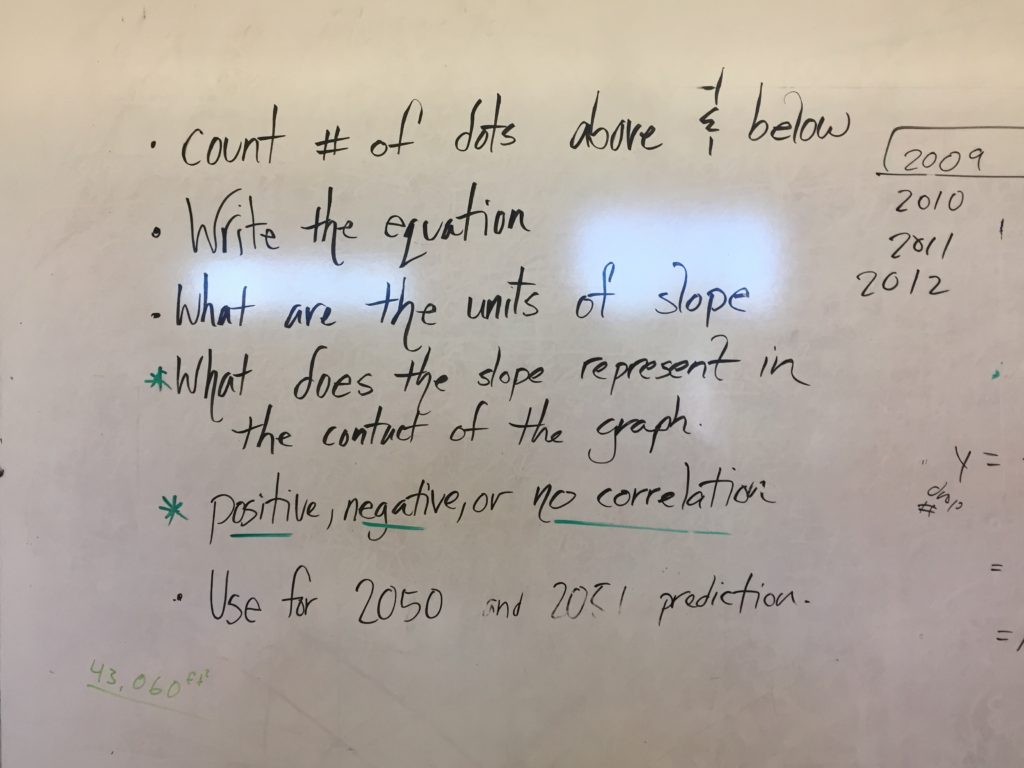
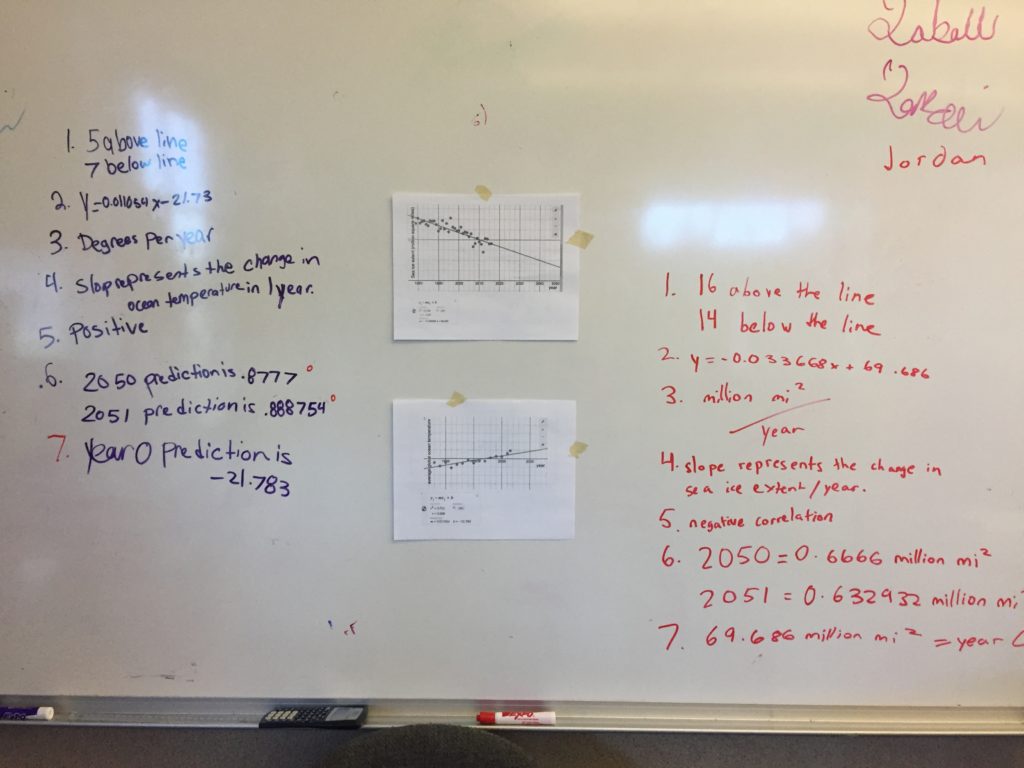
The high exit question – which I delivered orally – was to ask them what does the line of best fit predict for year 0?  And if they thought it was reasonable to use our line of best fit for a prediction about year 0.  We discussed domain and how it’s probably not best to use this post industrial revolution data as a predictor for before the industrial revolution.

I ended with them doing some worksheets “alone” (wearing headphones or ear plugs, no talking, must write questions on a paper) and then “individually” (able to talk to neighbors).

In Retrospect:

Here’s what I didn’t do well:

  • Having students keep a written or digital record of the activity.  Since it went over several days and was done a lot at whiteboards and on Desmos, there wasn’t much official to turn in.
  • Similar to above – but having a more official paper for them to write they group members, car number, daily reflections, and so forth.
  • Although they dealt with the repeatability issues in the first activity, I didn’t really go back to that idea and discuss what is the optimum number of measurements for the challenge.
  • I wanted to cut out more alone time.
  • My students mostly were unable to think consider the nature of the relationship.  They tended to assume linear and go with it.  I clearly did not do a good enough job last semester having them contrast the different relationships – linear, exponential, quadratic, other.

Conclusion:

I’m happy.  I think the goal was achieved of having them understand what a line of best fit is and how to use it to make decisions.  Next year it will be better thought.  And there will be a next year with this one.


Cheers!

-B