Category Archives: #reasoning

Adding Value – A Starbucks Lesson

This lesson could be better – but it was my first shot at it. I still definitely recommend it because of the great math conversations we had around convenience and adding value. Here’s the driving question I used:

What is Convenience Worth?

But it didn’t work as well as I wanted it to because we were really only looking at the convenience of the k-cup vs. ground coffee vs. going to a coffee shop.  It’s a cool driving question, but not necessarily the focus of this lesson.  This lesson is based more on “adding value” – where value is defined as what people are willing to pay for.  Starbucks added value to it’s coffee grounds by putting them into K-cups, and that is why they are able to charge more for it.  So how much value did they add?

So here’s the lesson:

Angle 1:  K-cups vs. Ground Coffee

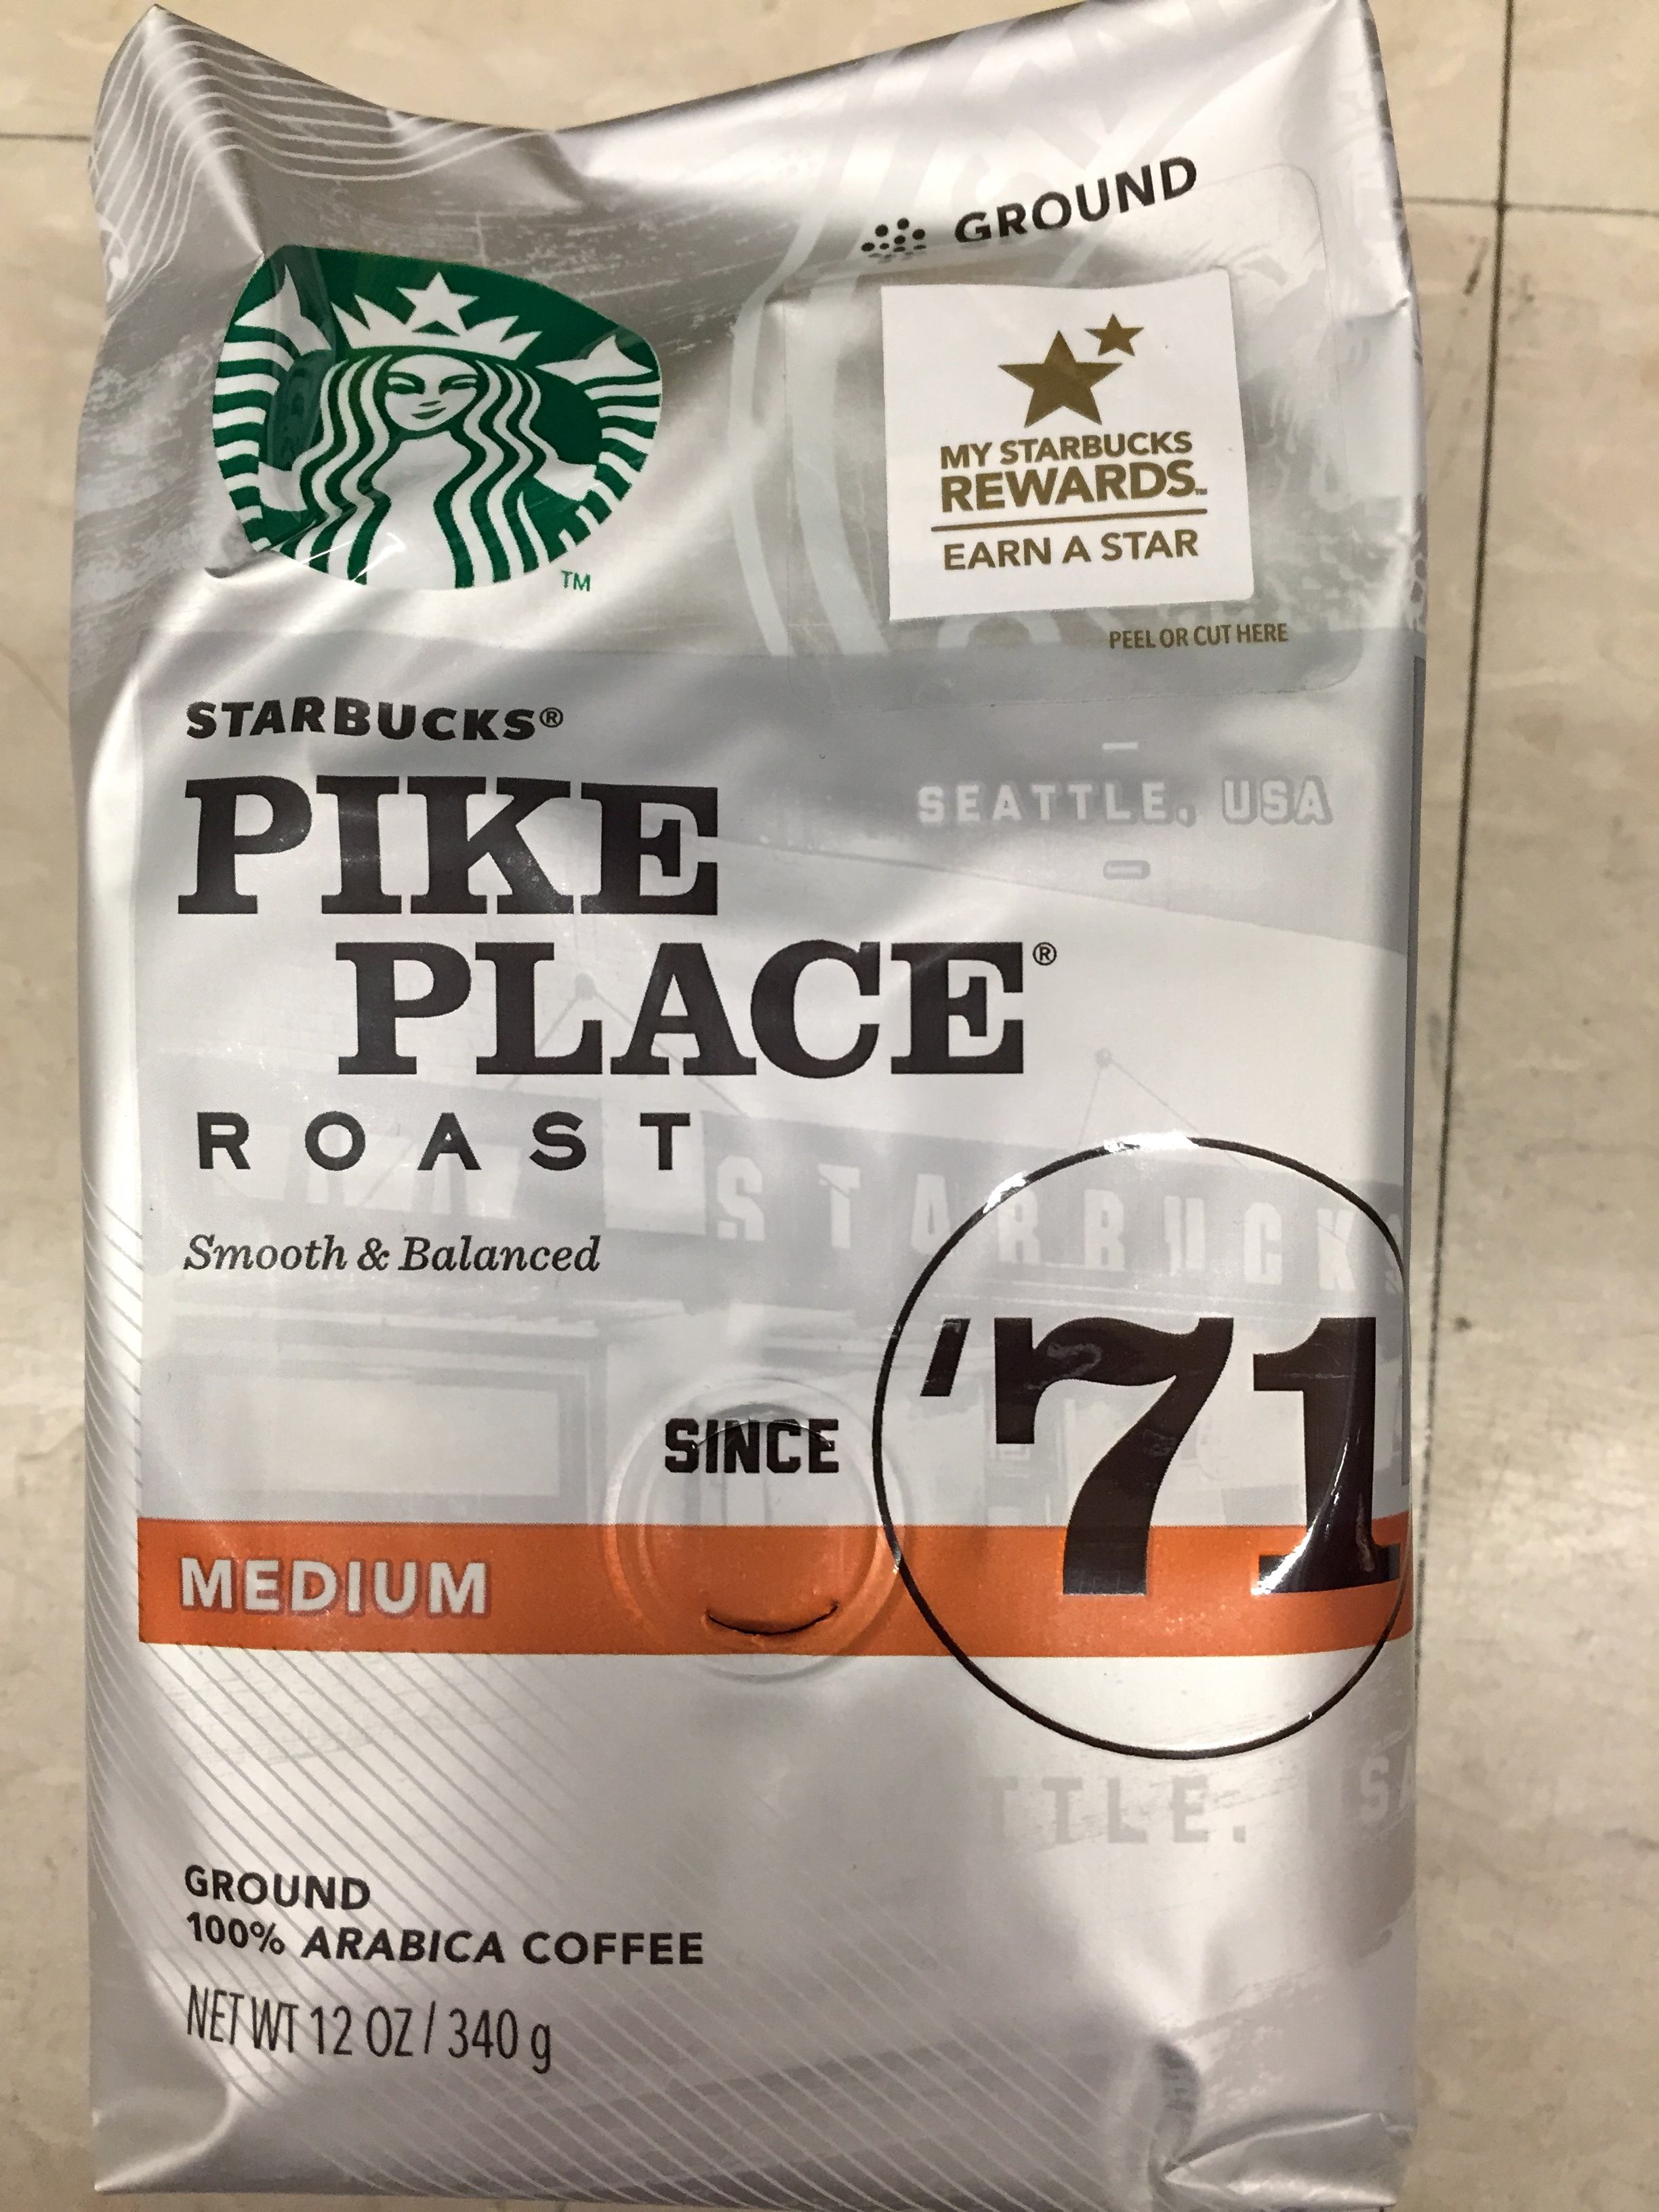
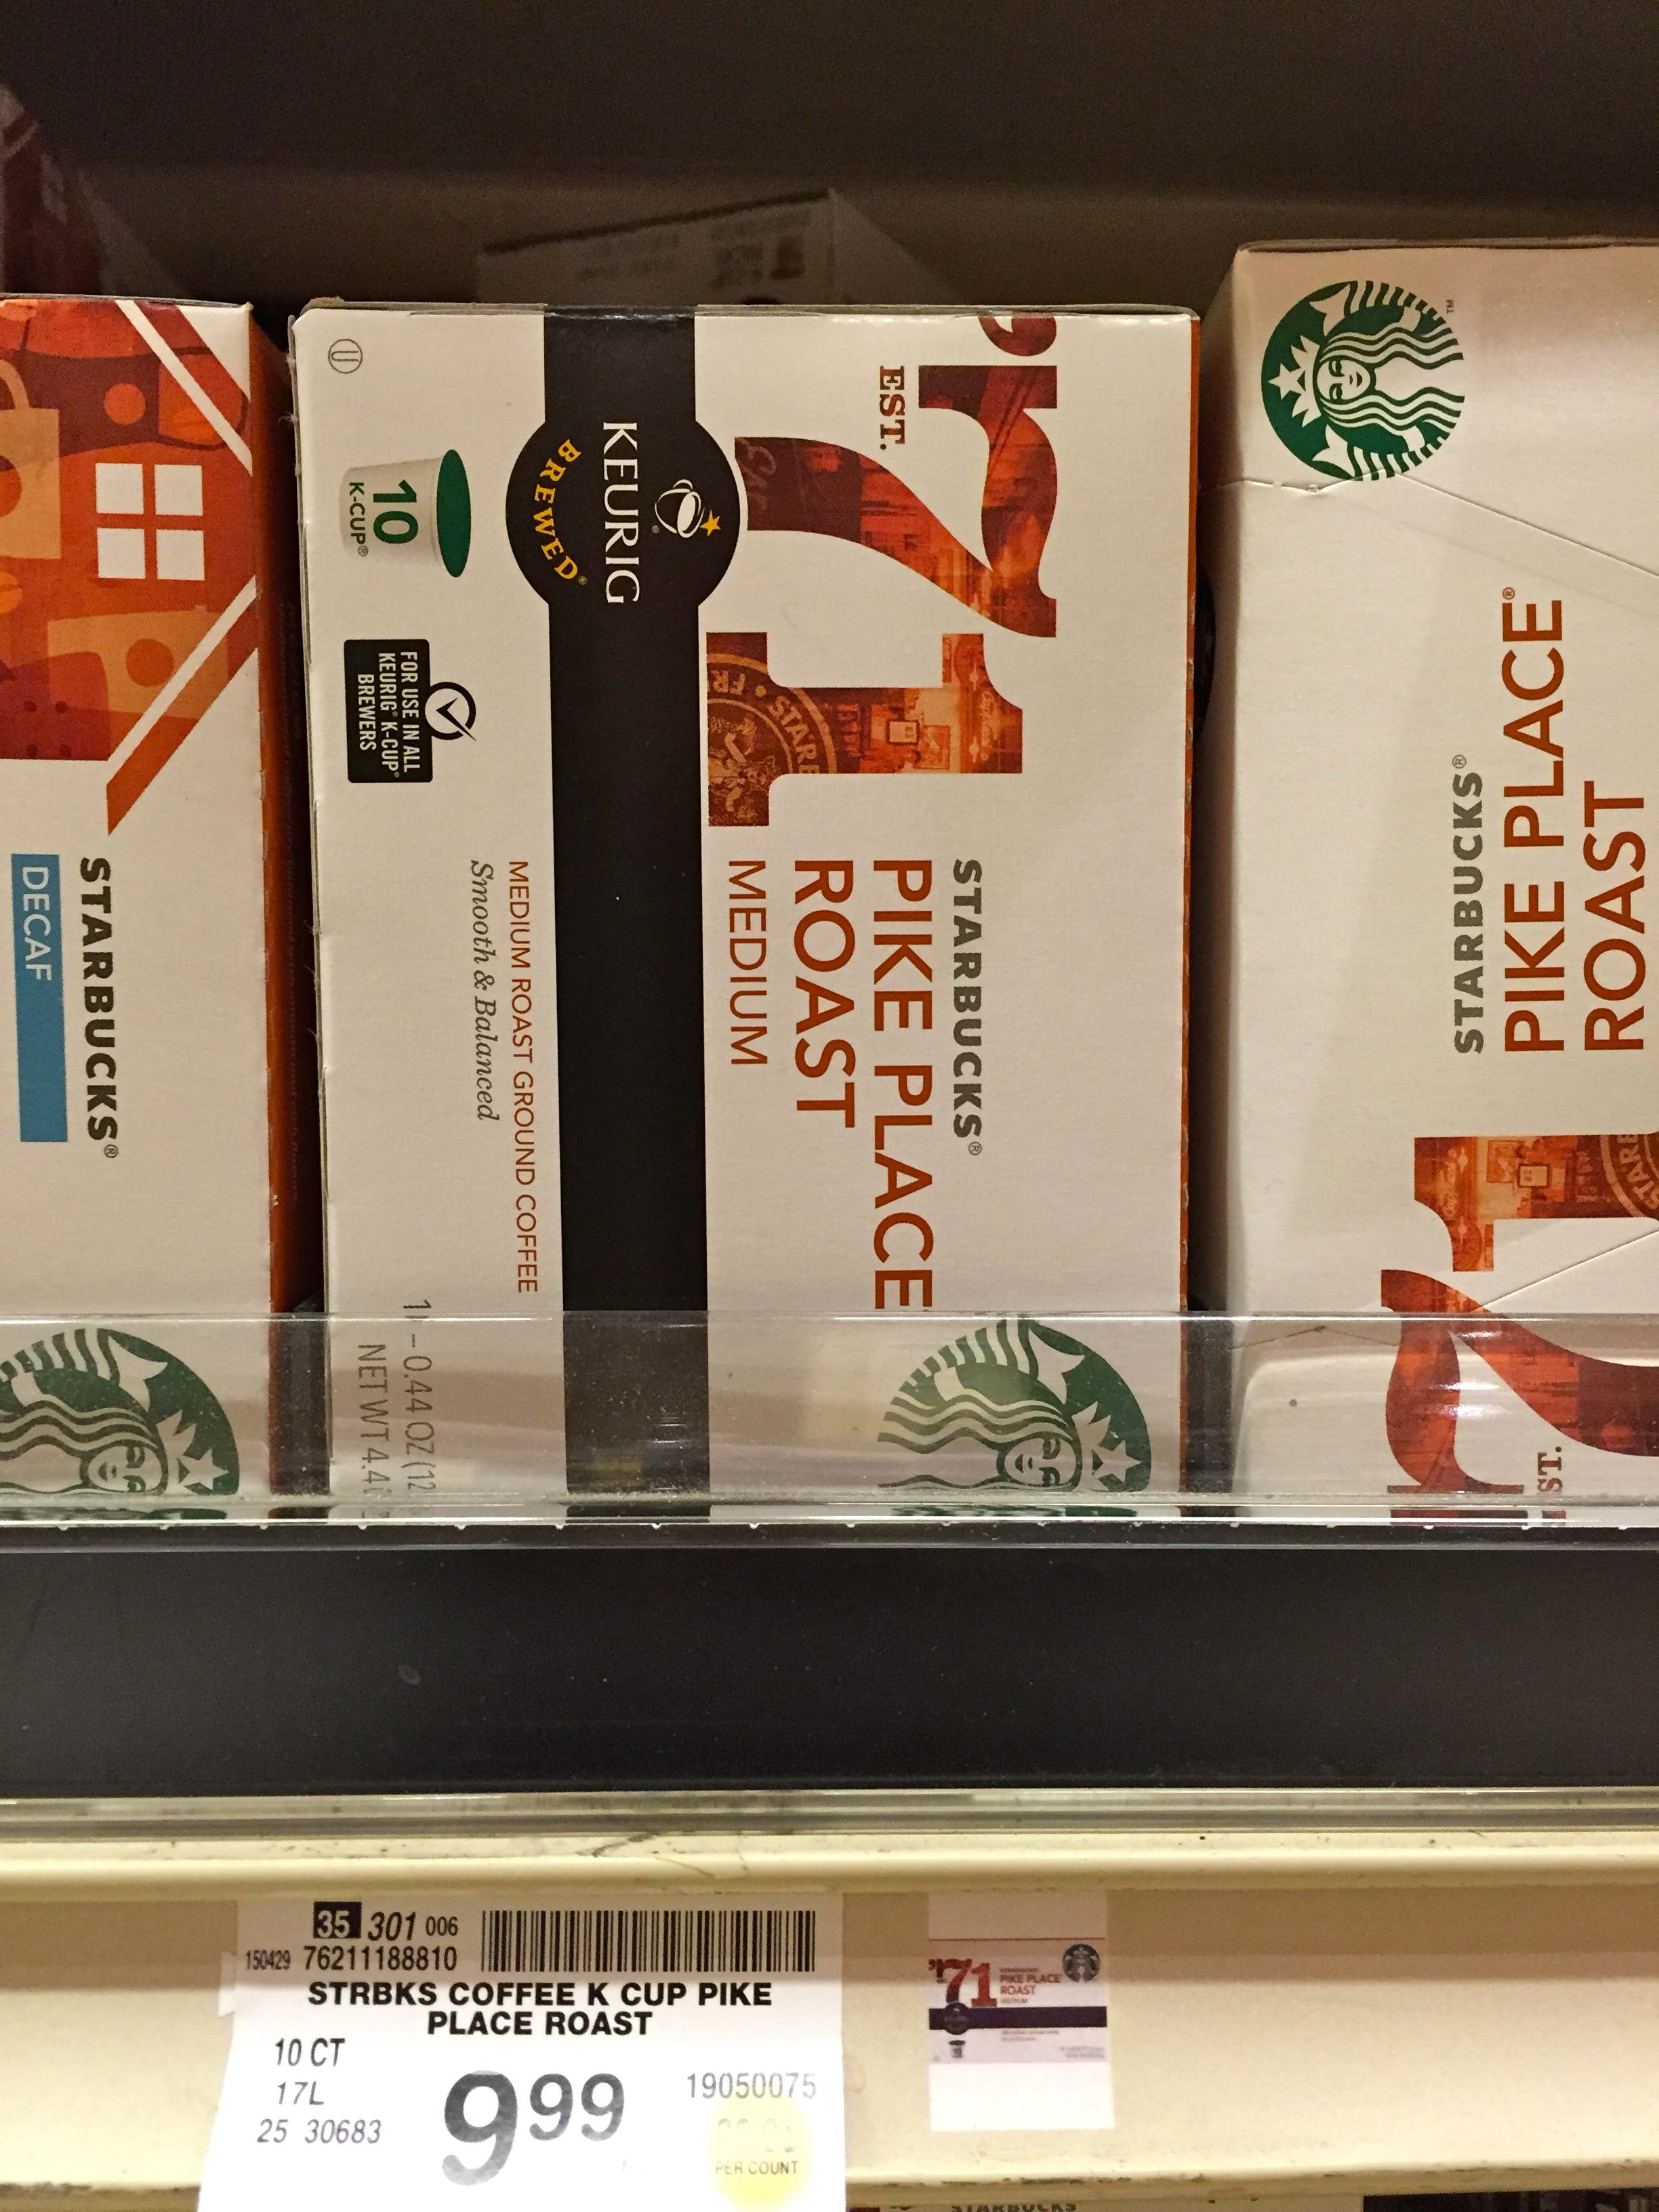
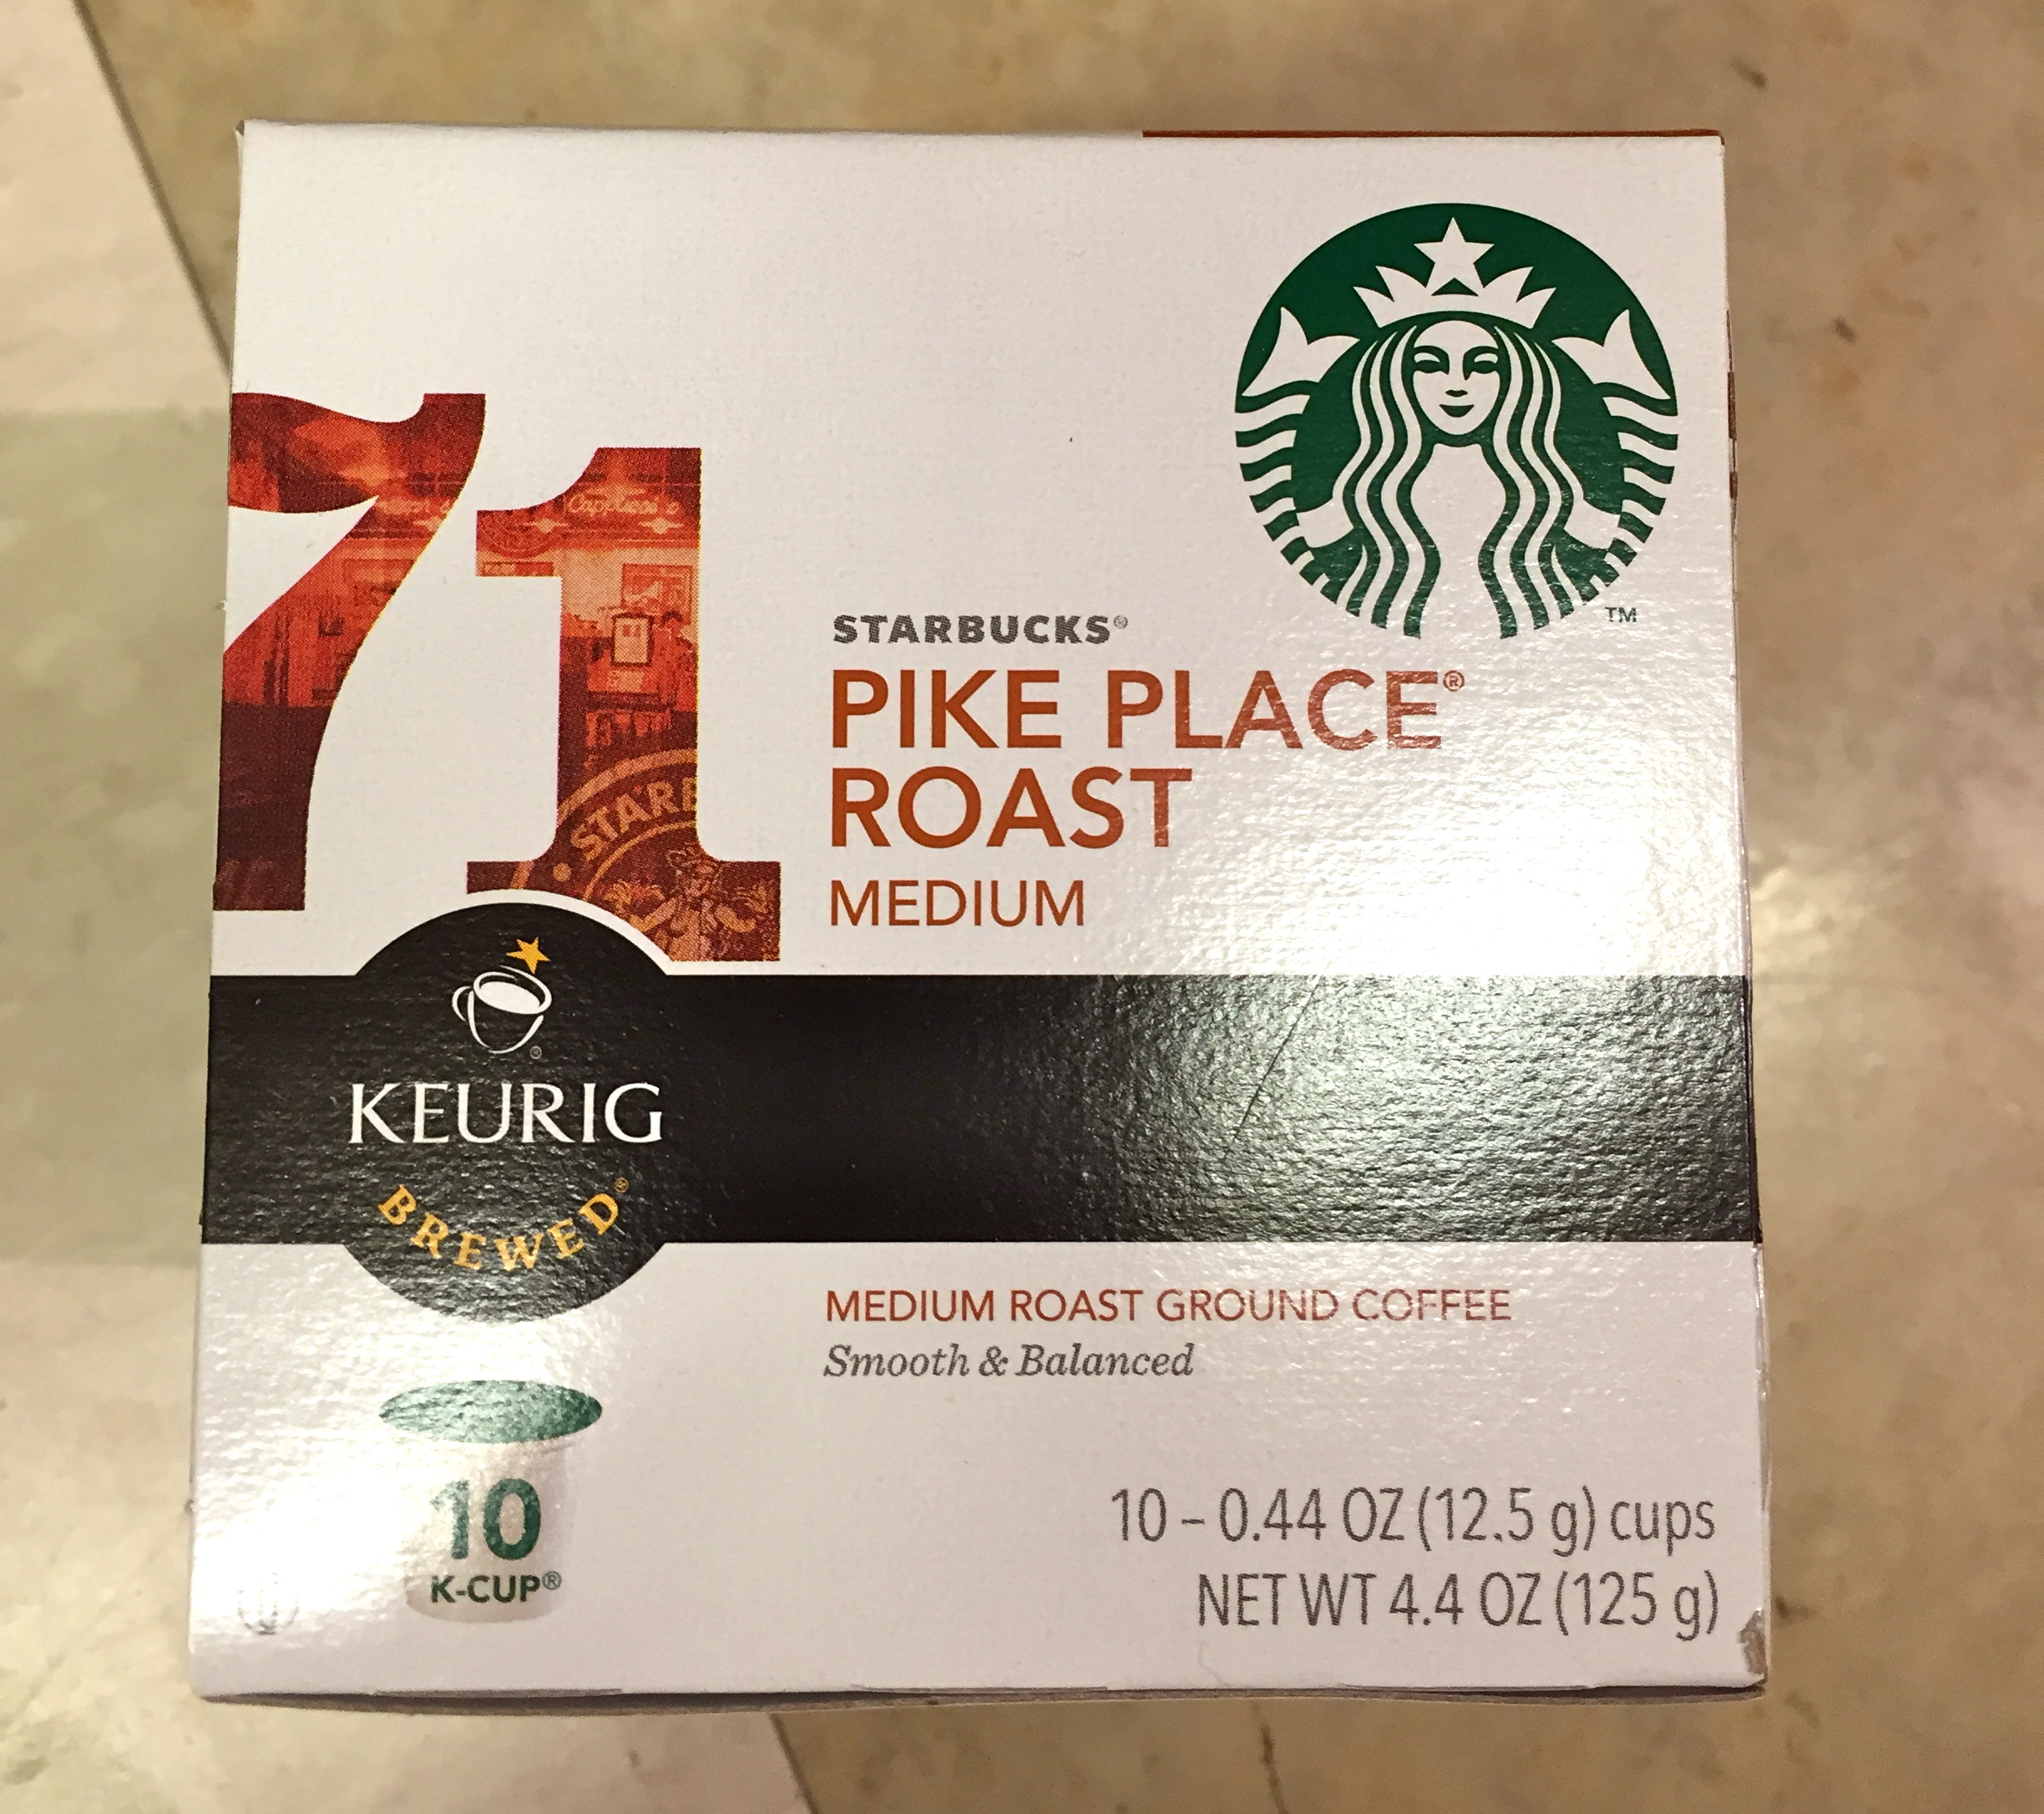
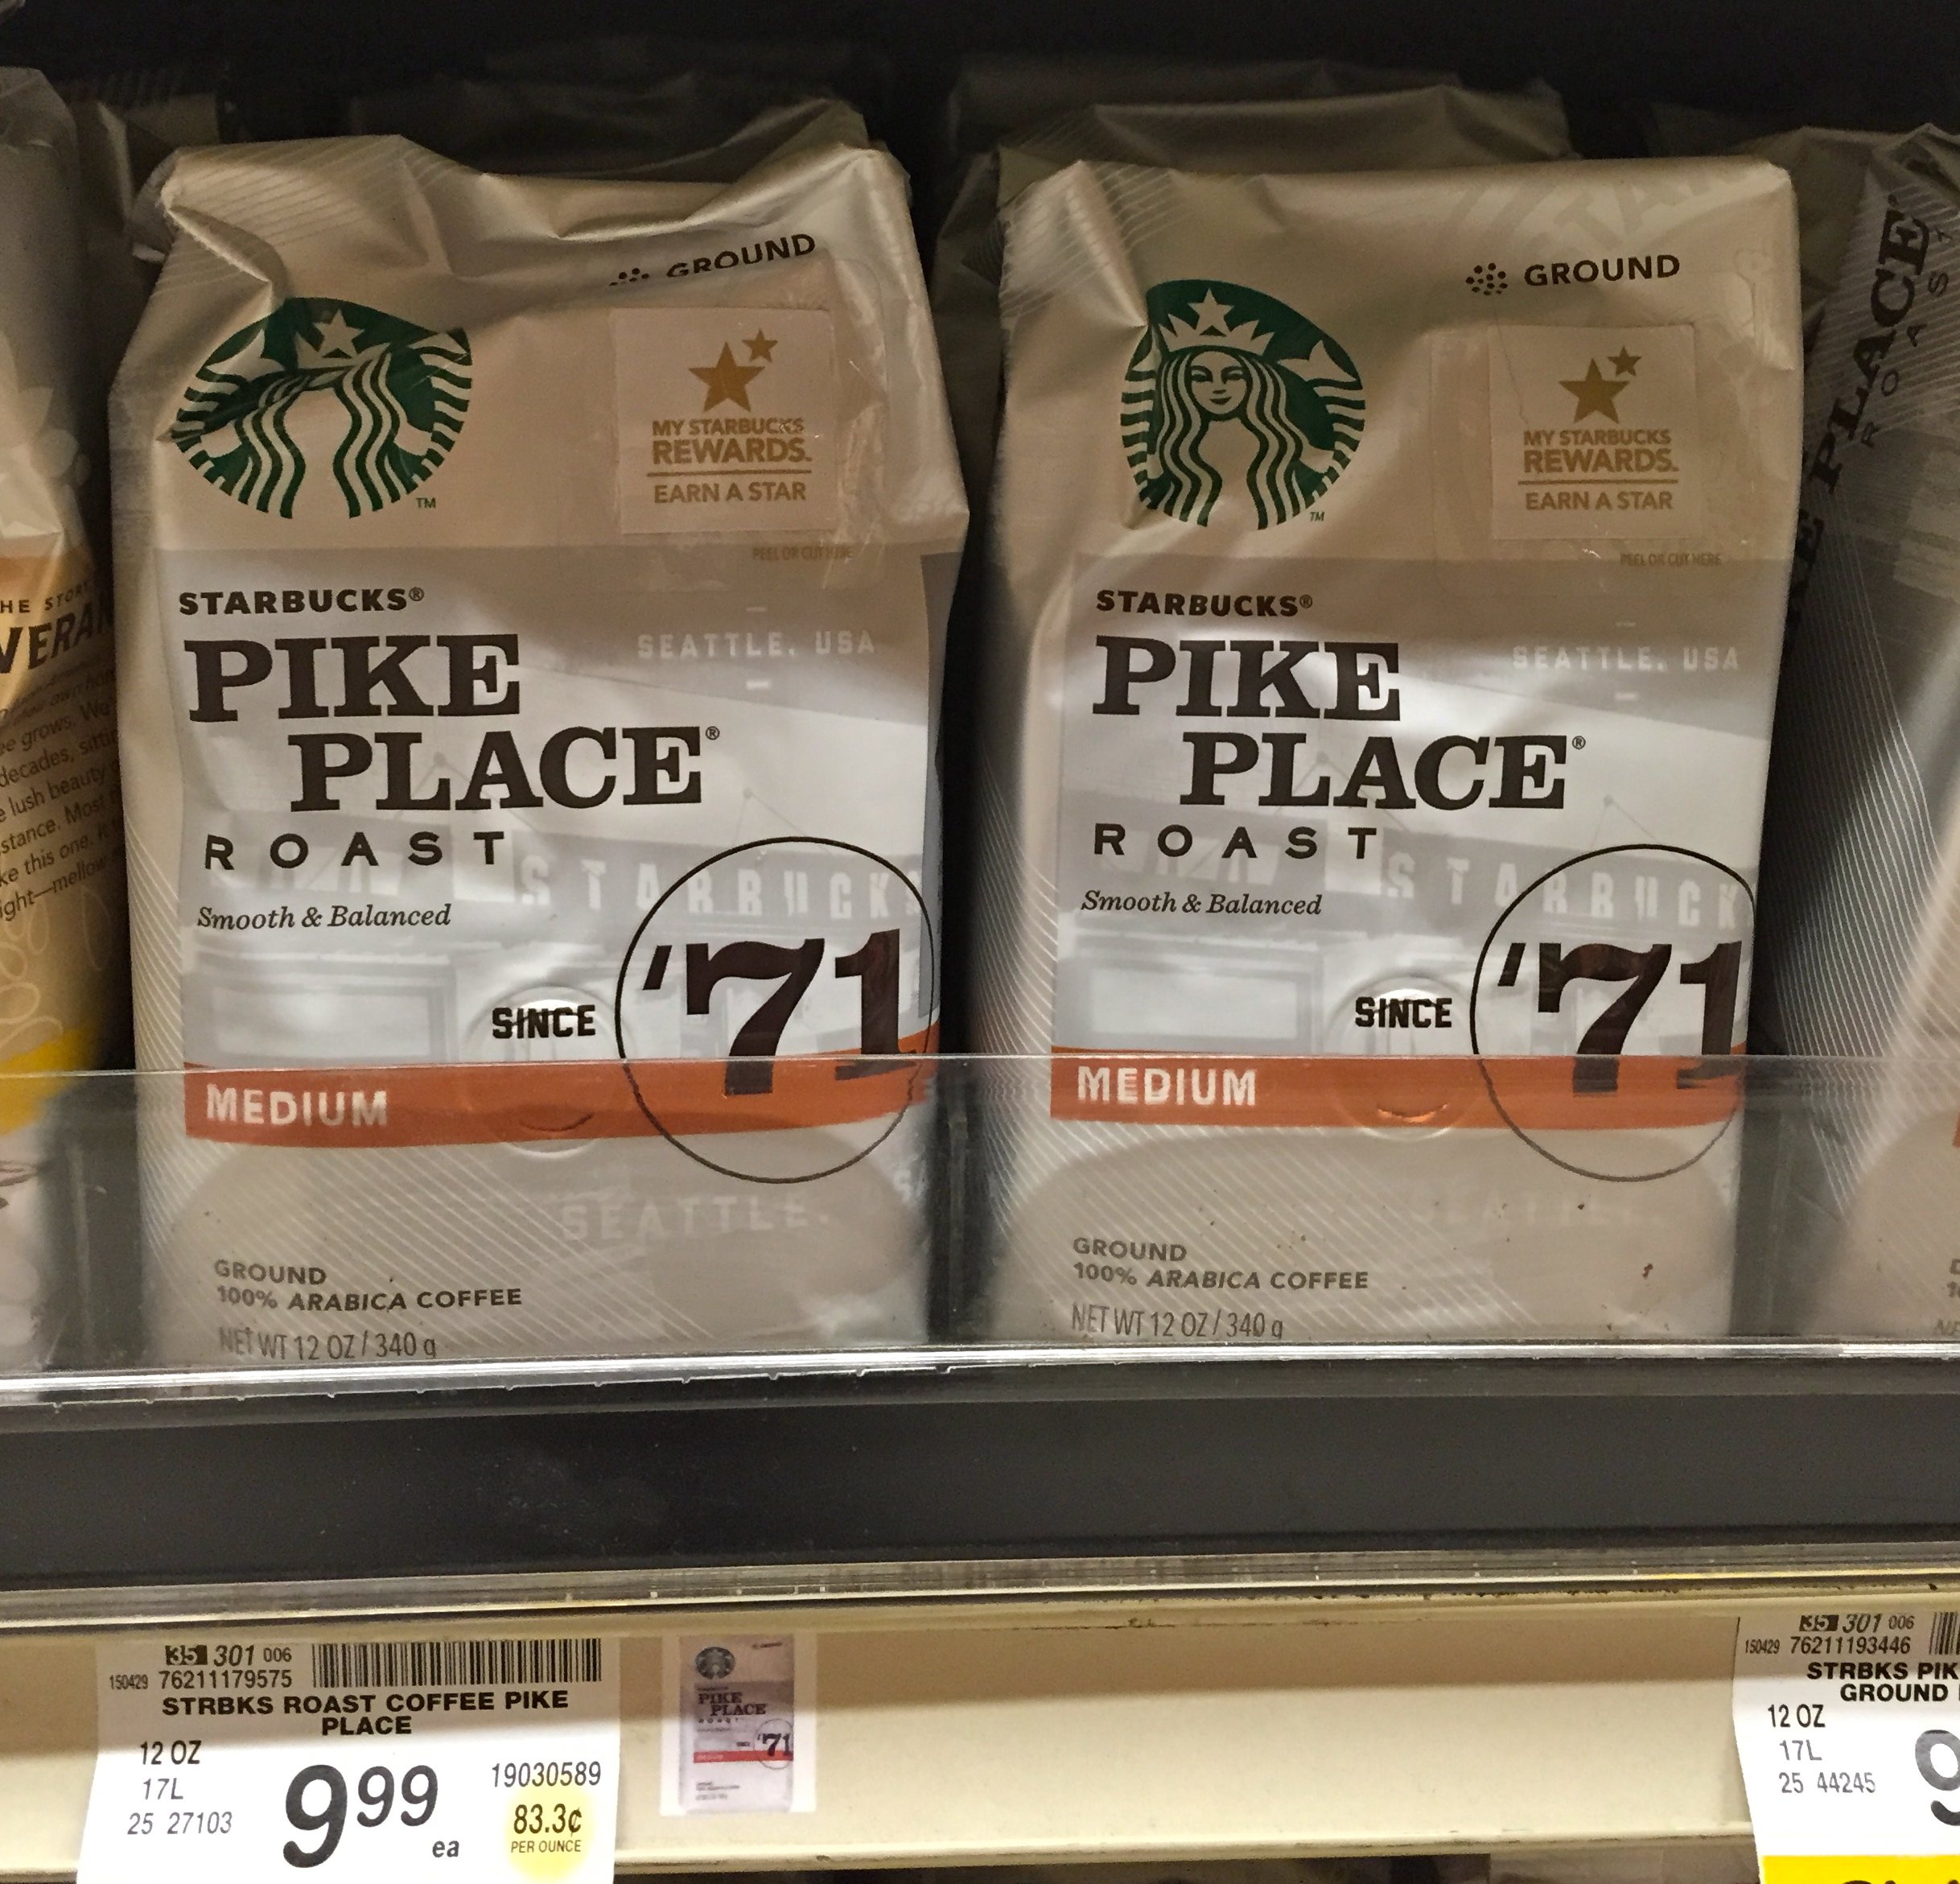
Starbucks makes K-cups and ground coffee, and both sell for $10!  [excellent] So are they the same price?  The K-cups are a package of 10, 12.5 gram cups.  And the ground coffee is in a 340g bag.  Starbucks is able to elevate it’s price for K-cups because they are more convenient than traditional brewing methods.  So what’s the value of that convenience?

IMG_2741

IMG_2742

IMG_2732


IMG_2733

Angle 2:  Coffee Shop vs. Brewing At Home

It is more expensive to buy a cup of coffee at Starbucks than it is to brew it at home.  Yet people still do it.  What does that cost difference tell us about the value of convenience?  Here’s one of Starbucks menus:

IMG_2748

There was definitely a period at the beginning where students did not know how to begin – or perhaps what they were suppose to do.  It took some time for them, and to extent me as well. to define the question.  I told them that it is natural in any problem solving situation to spend time defining the question, framing assumptions, setting up your analysis.

My teacher moves were as follows:

– Write about a time when you paid extra for convenience.  Talk it out.

– Ok so the value of convenience depends on how convenient the thing is versus the alternative.  [Future project could be to quantify convenience itself, rather than only focusing on Starbucks pricing].   That means we should standardize the convenience we are analyzing.  So let’s look at convenience through the lens of Starbucks pricing.

– What does the pricing of Starbucks coffee tell us about the value of convenience?  How could we use Starbucks to quantify its convenience.  What information would we need?

– Give various pricing data

– Ask students to come up with a value for the convenience of the k-cup vs. ground coffee, or the value of going to Starbucks versus brewing at home.

– Helping individually.   My most effective question was “For $10 you get 340g of ground coffee.  How much would it cost to get 340g of coffee in K-cups?”

It is also an interesting conversation that ground coffee and whole bean are the exact same price.  So Starbucks is saying that the convenience of having the beans ground for you adds no value to the product.

After the activity we read an article from Proffer Brainchild titled “ADDING VALUE:  A Lesson From Starbucks”

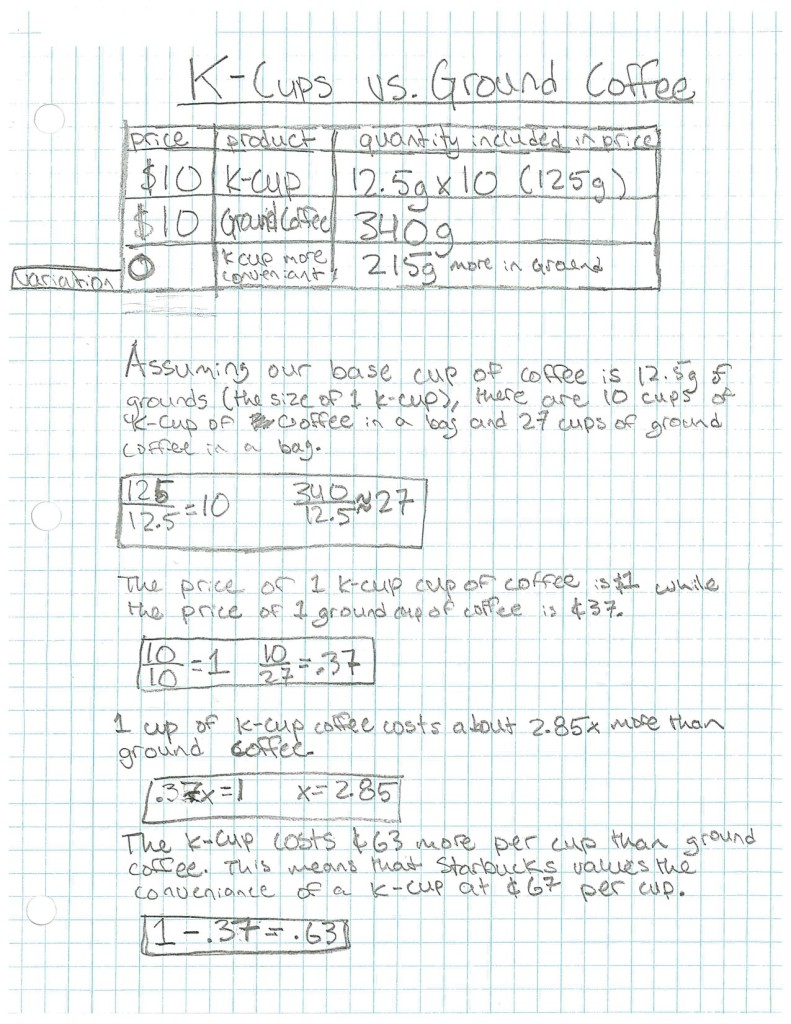
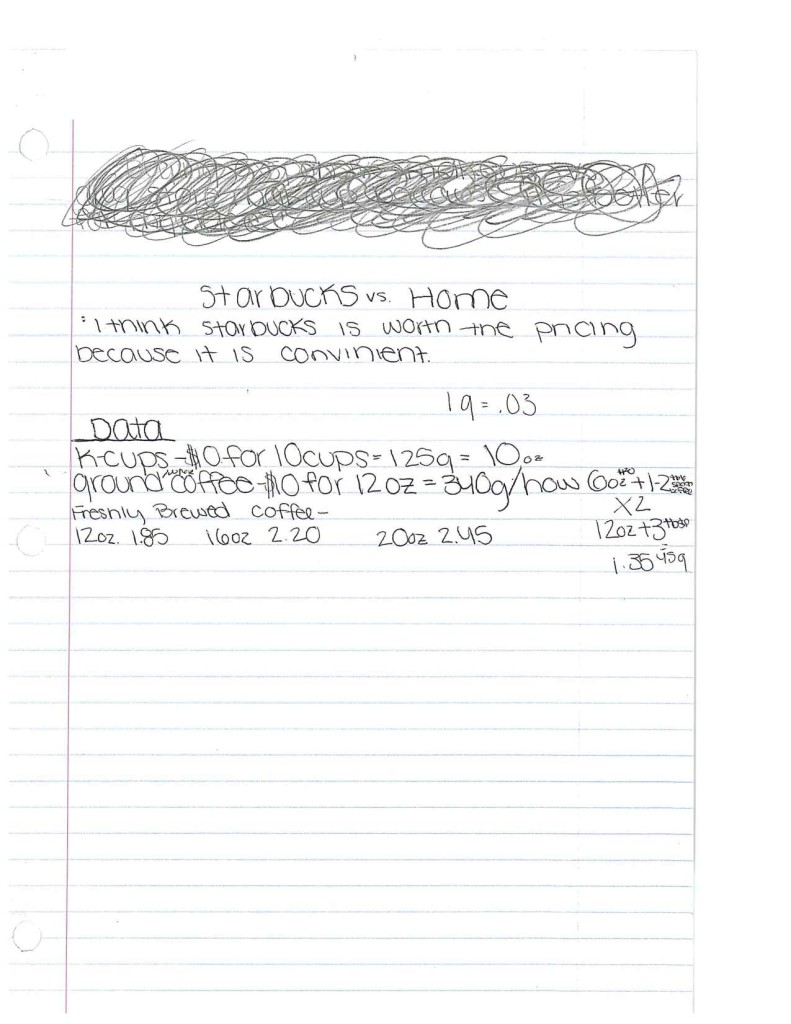
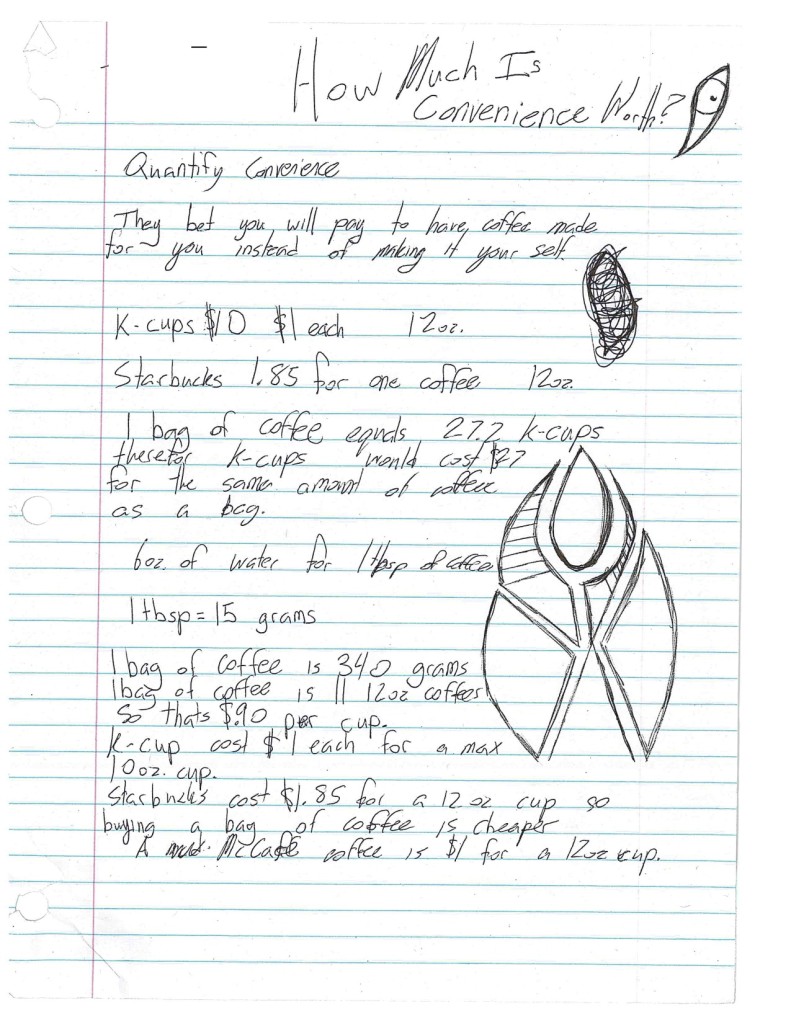
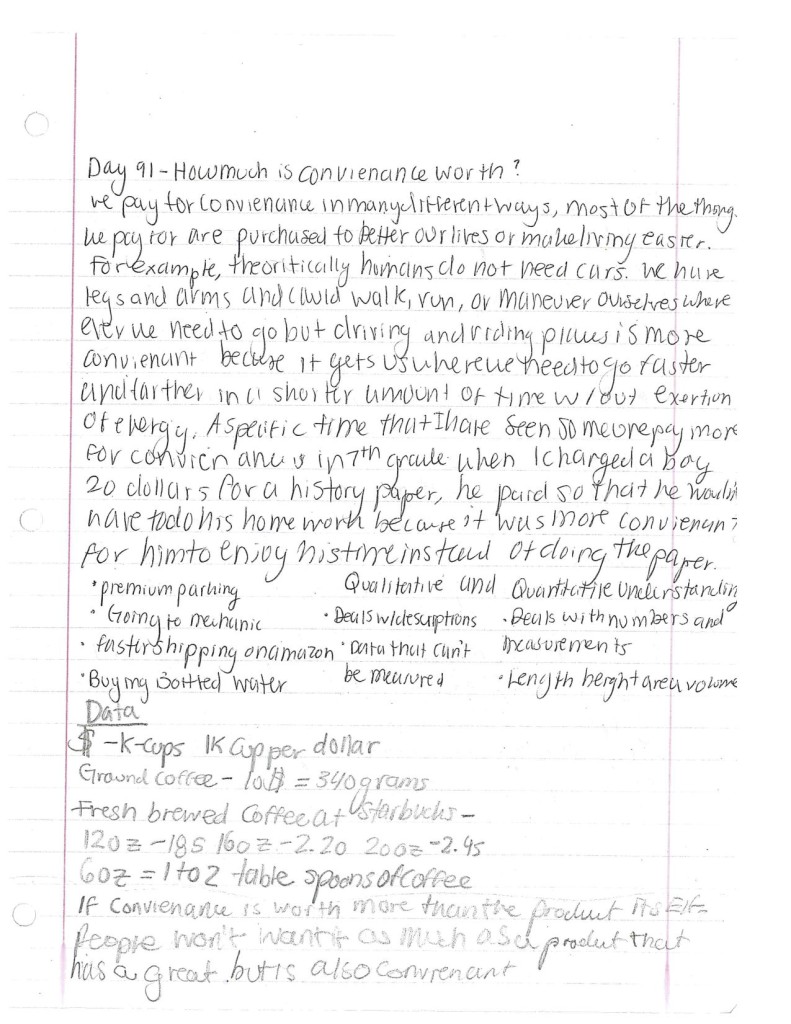
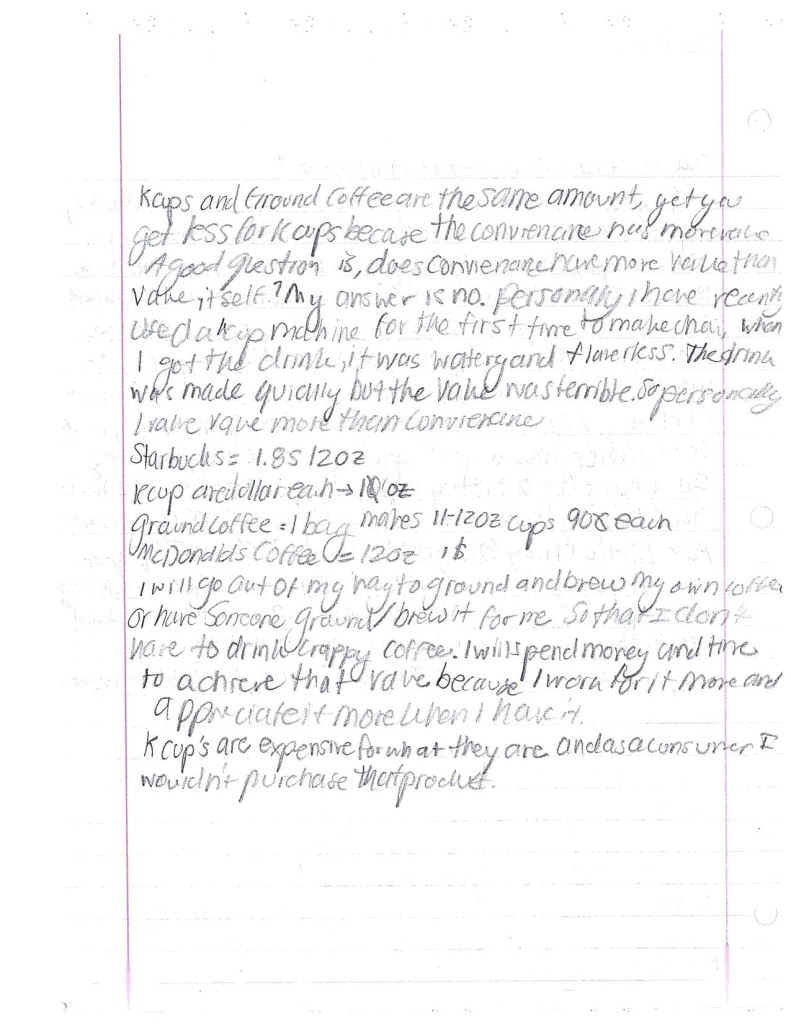
Here are some examples of student work.  The first example was the highest quality paper I received.

SW_AddingValueOliver


SW_AddingValue2


SW_AddingValue1

Lesson Learned:

It’s clear that not all students understood what I was asking – and so I concede that “What’s the value of Convenience?” was not a good driving question for this particular activity. I do see it that prompt as a great math modeling problem where students try to quantify an inherently qualitative thing. But that’s not what they were doing here.

Next year I am going to try and focus first on the k-cup vs. ground coffee prices and stick the economics concept of “adding value”. How much value is added when Starbucks puts their grounds in K-cups vs. ground coffee? And this is not just about the calculations, it’s about the argument.

 

SW_AddingValueZoe1

SW_AddingValueZoe2

Explaining “Explain”

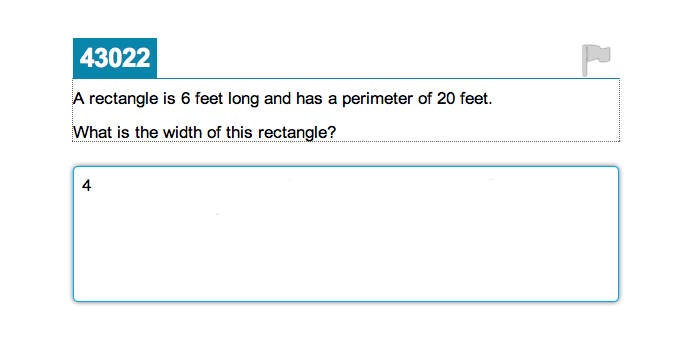
Here is a released question from Smarter Balanced (I even answered it!!!):

ExplainingExplain2

Ok I lied.   That was an edited version of a Smarter Balanced question – here’s the original:

ExplainingExplain1Now all of a sudden my answer doesn’t seem sufficient anymore 🙁   Here’s my best guess at a popular student answer:

ExplainingExplain3

This word “explain” is keeping me up at night lately.  In this problem I’m not sure adding the word explain to the end gains us enough to warrant it.  To achieve Common Core we can’t just throw the word “explain” after every problem we did last year and call it a day.  By the way I’m not saying that’s what the Smarter Balanced Consortium did on this particular problem.  But this use of the word “explain” does bring two things to mind:

1.  It’s hard to explain your mathematical reasoning without access to drawing diagrams.

2.  If we ask students to explain something – it should be something worth explaining.

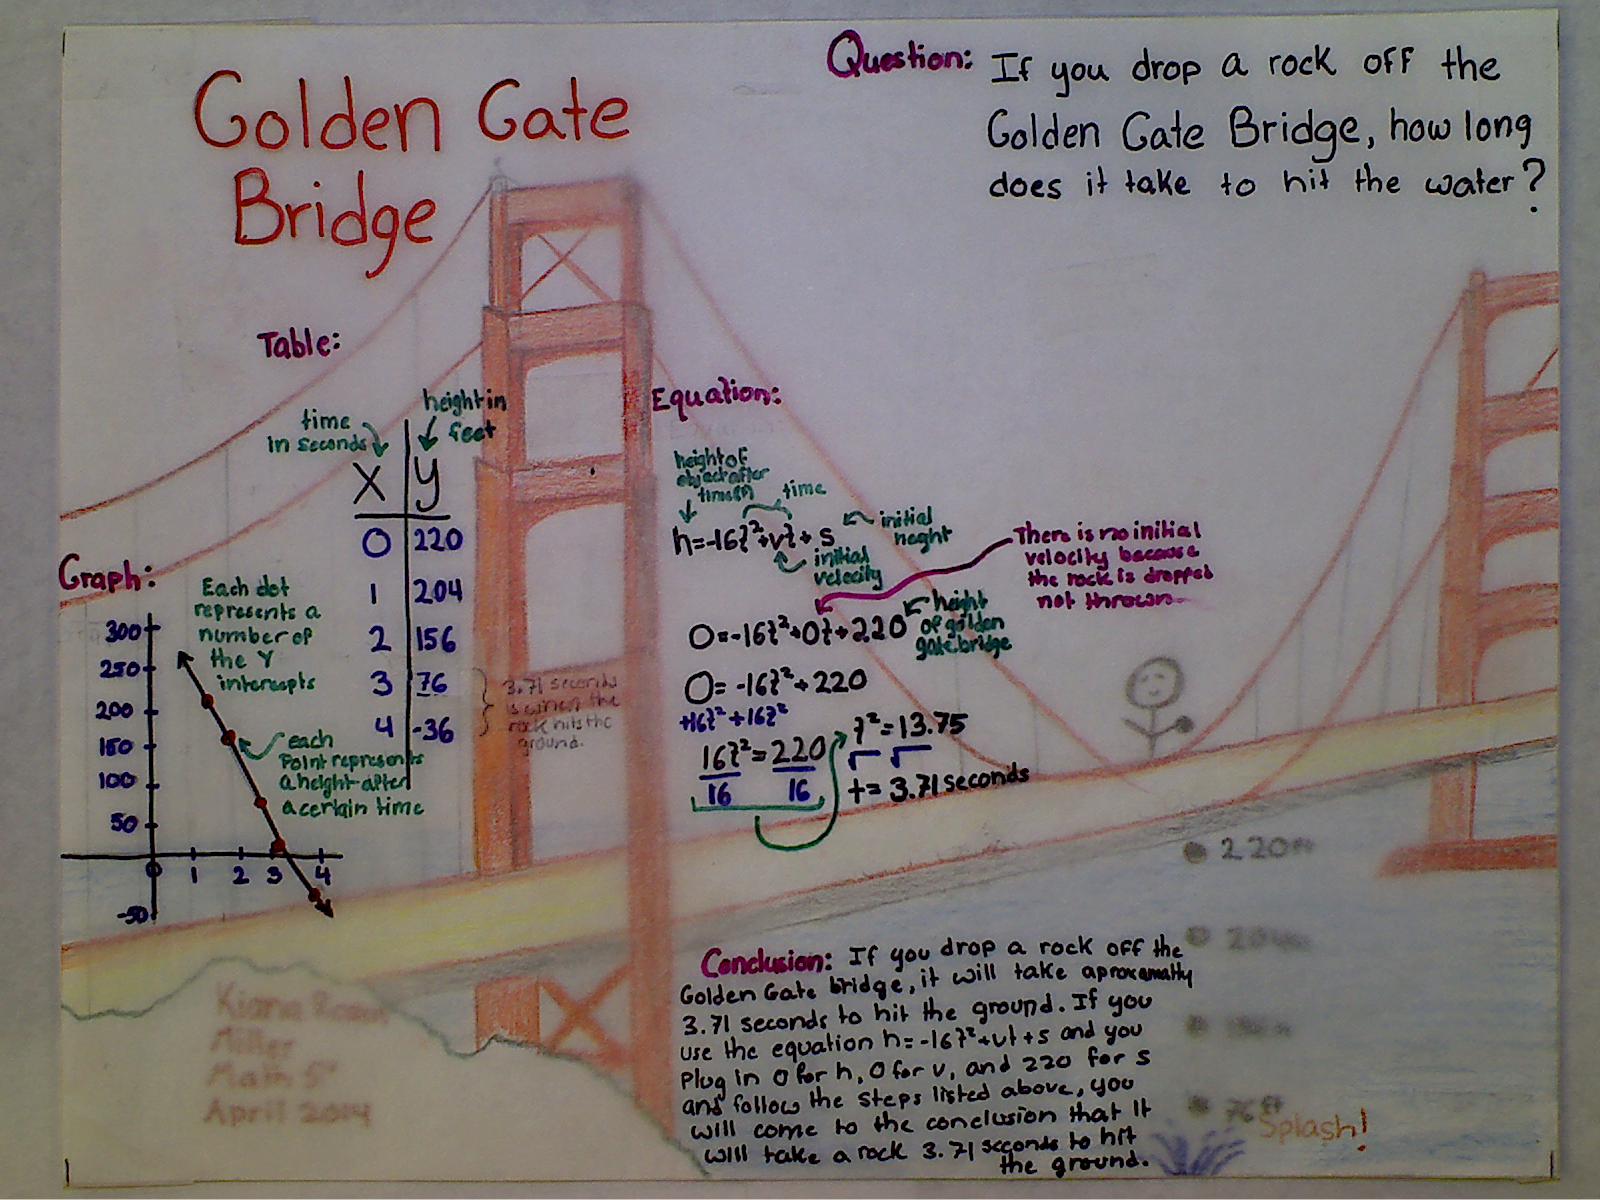
With respect to #1 – my focus this year has been on explanations through multiple representations.  Basically I have students make connections between diagrams, tables, graphs, mathematical symbols, and written descriptions.  I feel underwhelmed asking students to explain with just a typed explanation.  I want explanations to look like this:

SGBridge

In the student work above – image if it was only the conclusion.  Look at how much would be lost.

There are certainly better answers to the rectangle problem from Smarter Balanced than I offered up here.  I actually really like the problem itself, I just do not think having them explain it gains us much versus just solving it.

It’s hard to explain the word explain.  It’s a word that only makes sense to me until I try to explain it.

Missing Assignment Buyout Program

The Overview:

This year I wanted to do Kyle Pearce’s Detention Buyout Program that Dan had highlighted in his Great Classroom Action series.  The problem was that in my new school we don’t have detentions, so I didn’t think I would get much buy-in from the students.  But there is something that all schools definitely do have:  Missing assignments!  So I created three “deals” that would allow students to pay me money in exchange for getting credit for an assignment they missed.

I used this assignment as an introduction to inequalities, but I also wanted to link the Missing Assignment Buyout Program to the linear equations we just finished covering.  That is the why as you look at this assignment, you will see a focus on connecting the information in the graphs to the information contained in the inequalities.

I sequenced this by first giving the assignment.  Then two days later I did another version of it as an opener / warmup.  And then lastly I put another version of it on their test.  Each new version offered slight modifications from the previous.

The Description:

I first offer students three possible deals for buying off their missing assignments.  I poker face the whole thing and enjoy all the “Is this legal” expressions on their faces.  I tell them to make sure they go home and talk to their parents about how much money they have budgeted for such as program.  The first question on the worksheet asks them which deal is better for them, so as an added bonus I printed out each students missing assignments and handed it to them.  This is that first worksheet:

MissingAssignmentBuyoutProgram_Page_1

MissingAssignmentBuyoutProgram_Page_2

There are a lot of interesting questions and explanations that came out of this first assignment.  For instance, having students see that x less than 5 was the same as saying x less than or equal to 4 since x could only take integer values.  Also having students see the connection between the intersection points of their graphs and the inequalities they wrote was time well spent.

A couple days later I came back to the Missing Assignment Buyout Program in the form of a opener or warmup question.  I handed the students this graph when they came into the room (two graphs per page to save paper):

MissingAssignmentBuybackProgramOpener

Then I had students write a description of each deal, as well as the inequality and equation for each deal.  This was a slight inversion of the original assignment where I gave them the description and had them write the inequality, equation, and then graph.  Now I am giving them the graph and asking them to write the description, inequality, equation.  I have them in pairs and am checking homework and taking role while they work.  Then I randomly call on pair share partners and fill in the following table that I am projecting on the board:

Screen shot 2013-11-27 at 5.18.48 PM

Lastly to make sure that they really did understand the concept, I put a similar problem to the opener exercise in their inequalities chapter test.  The test had a slight twist in a scenario where a student would want to buy the Flat Fee plan based on their number of missing assignments, but based on the money they had to spend, they would need to pick their second best option.  Here’s that problem:

MissingAssignmentBuybackProgramTest

I initially thought having them graph each deal was kind of an unnatural excercise, because why would someone ever graph something like that?  But I think it ended up working because of how the Opener and Test question both refer to the graph.  All in all student engagement was high, even with the graphing portion so I think I’ll keep it next year.

The Extension:

(good idea courtesy of my principal)

Tell the students that you have decided to only offer one deal to the whole class, and they have to decide which deal they want for the class.  This could open up a nice debate about fairness and equity – this deal is best for you since you don’t have any missing assignments, but what about these other students?  Connect this debate to something current, like Obamacare.  Discuss how math influences decisions and that often decision makers have to make decisions based on their believe on the greater good, even when the numbers indicate that some people will be negatively affected by the decision.

The Goods:

MissingAssignmentBuyoutProgram

MissingAssignmentBuybackProgramOpener

MissingAssignmentBuybackProgramTest

Stacking Cups Assessment

When three of your favorite bloggers all write about the same lesson (Dan, Andrew, Fawn) it is a pretty safe bet that you should do the lesson.  I used Andrew’s 3Act video because my students can be pretty green and I might not hear the end of it if I couldn’t find an additional use for all these cups I was bringing into the class.

I don’t have anything to add to what was already said by Dan, Andrew, and Fawn, so I will just share a problem I created that you can put on your midterm that is a slight twist to the presentation of the original problem:

StackingCupsTestQuestion

1.  How many cups would stack in a 250 cm door?

2.  What are the dimensions of the cup?  Draw it and label it with the dimensions.

I suppose you could ask for the y-intercept and slope and all that stuff too if you wanted.

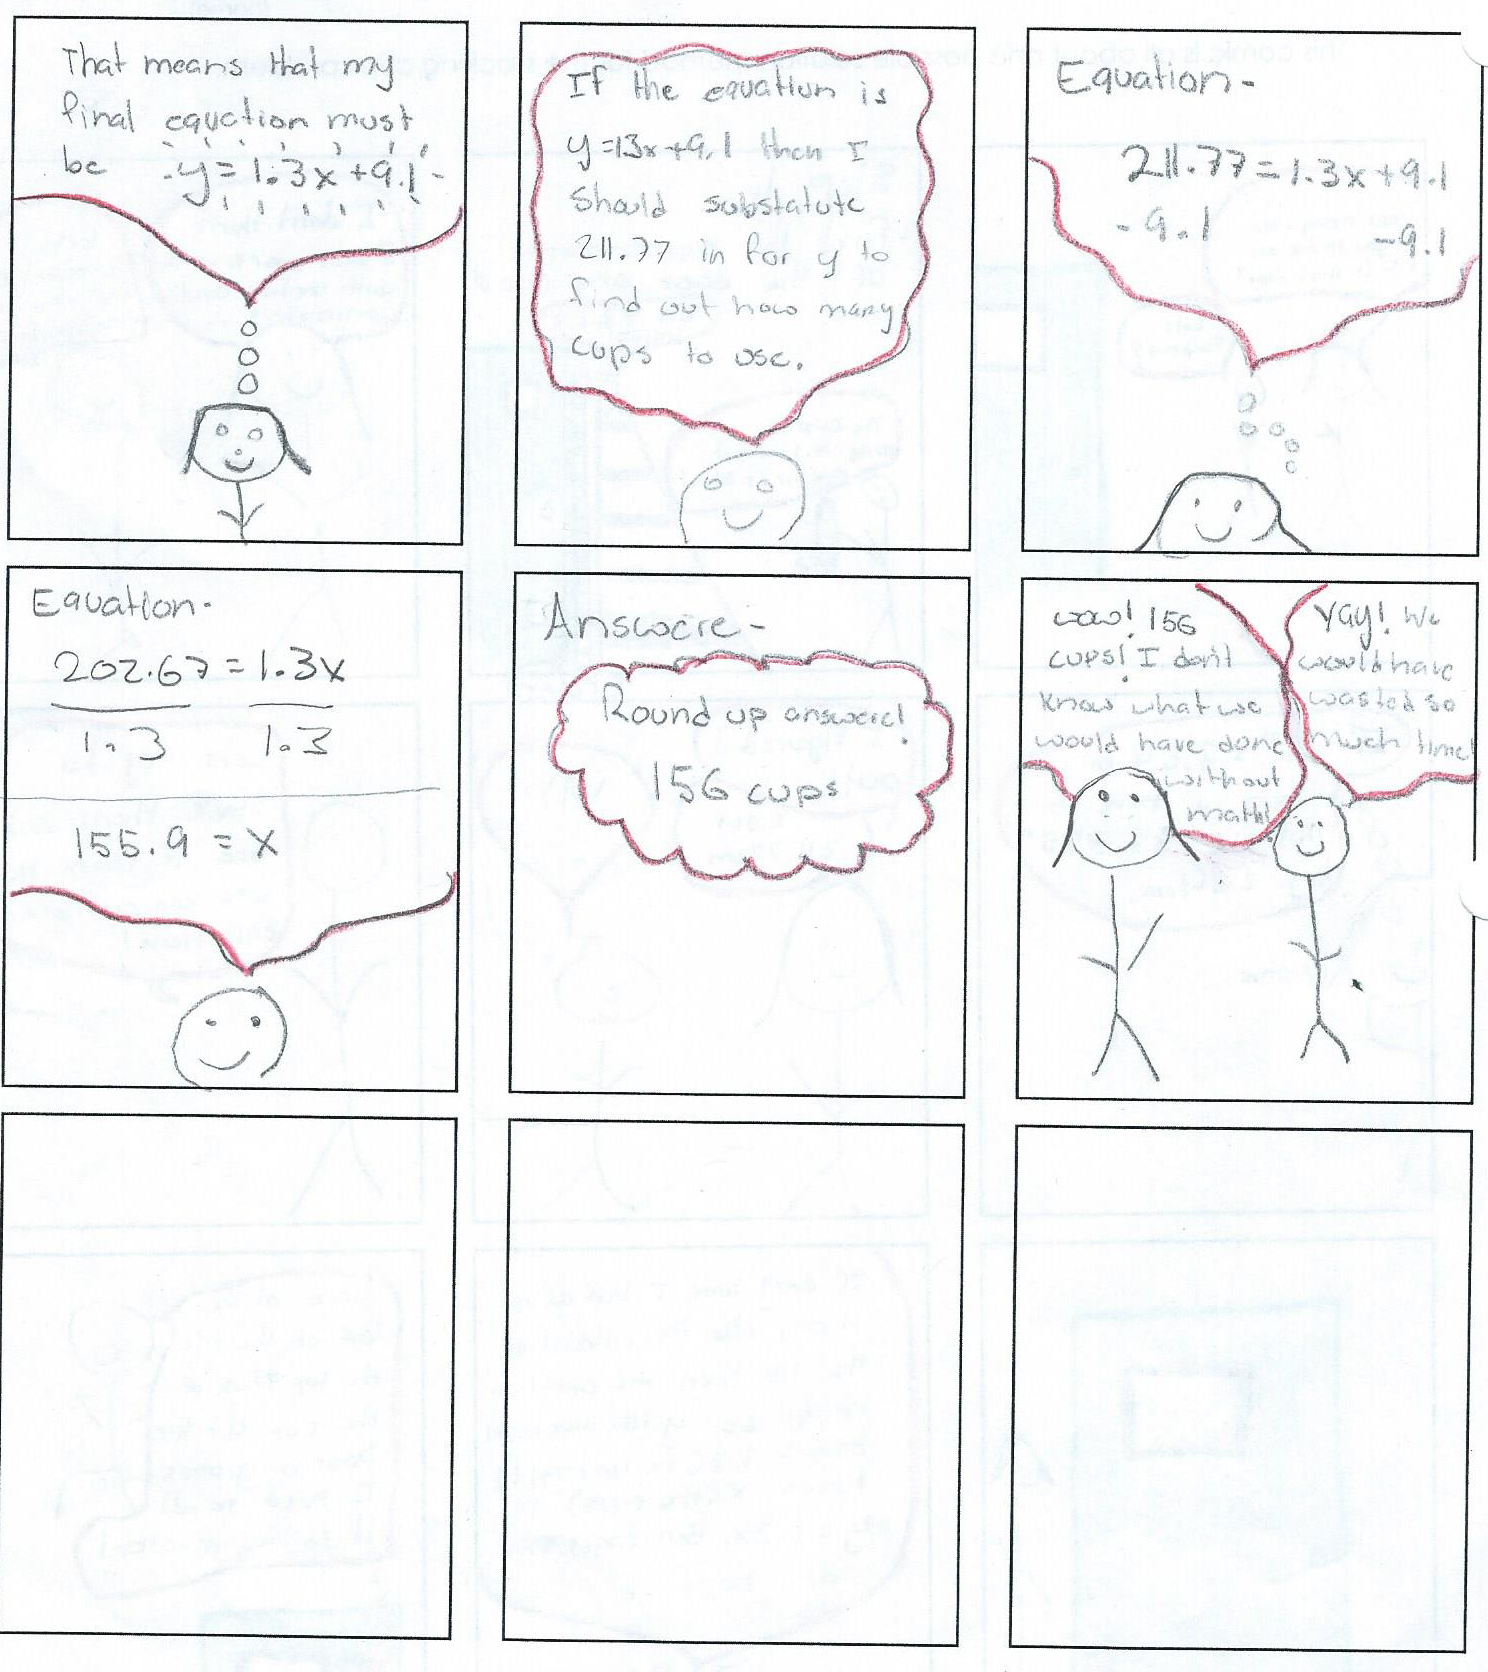
Moving on from test questions – The actual lesson went great for me and I am definitely looking forward to doing it again next year.  When I did this problem in algebra I had the students make a Stacking Cups comic that was supposed to describe how to solve the stacking cups problem.

SCcomic1

SCcomic2

I like the comic concept because I think this is a very visual problem, and since I didn’t provide them with actual cups they needed to create their own visuals.  I have been trying to get students to give me a visual for every word problem they do this year.  My stated reasoning for that has been that visuals help you give a clearer and more convincing justification for your solution.

In order for students to learn how to construct a viable argument and critique the reasoning of others (Let’s hear it for MP.3!!!), we are going to have to have an iterative process on a couple problems where they essentially hand in drafts, and we keep having them make improvements.  I think this is a great problem to do for that since it has a couple nice extensions for system of equations (different sized cups) and geometry (here).

The Centauri Challenge

I’m posting this because my students enjoy it and I can’t find it anywhere online.  I got it from a colleague a few years ago.  I have no idea where it originally came from.  It’s is a great intro to logic and proofs.

CentauriChallenge

CentauriChallenge

My Attempts At CCSS Word Problems

I’m trying to prepare for CCSS, so this year I have been looking at word problems with a specific goal of improving student literacy by connecting each problem to graphs and having students explain their solutions.  Then afterwards coming back to their solutions and analyzing them and improving them.  It’s been successful thus far based on my last assessment so well the hell – figured I share.

I started on day 1 with my Las Vegas Problem.  Then on day 2 I played this video of myself graphing the equations we wrote on day 1 for the two airports.

[youtube=http://www.youtube.com/watch?v=Ir1EHue9qIE&w=420&h=315]

Then I passed out this worksheet and have the students try to figure out why Wolfram Alpha was calling 14 the “solution”.

VegasGraph

I like the worksheet because it has the students try to explain which graph is for which airport, and this is before we have learned to graph or talked about things like y-intercepts and slopes.  It is just them connecting the story to the picture of the story.  The last problem on the worksheet was meant to highlight that context drives the graph, and that this particular graph should not have any negatives because you can’t have negative days.  But we had a good discussion there.

Since this is day 2 and these students aren’t used to having to “explain” their reasoning, I got a lot of papers that gave an answer without any explanation.  So I went back and did a Math Hospital and had the class analyze how to explain their solution.

MathHospitalVegas

During the Math Hospital I introduced them to one of the English languages most powerful and poetic words: “because”.  I showed that all they have to do is put that word after their solution and it will literally force you to state the reason for the answer.  CCSS literacy for me isn’t about having the students explain their thought process, rather it is about having the students explain why they made the decision they did.

I did a couple worksheets that were styled like the Vegas one and then I put one of them on Ch1 test (The Internets was on the test).  Every single student explained their answer on the exam.  After the test the class and I did the “Math Gym” where we take their healthy answers and make them healthier!  Basically teaching students that it’s great to choose internet company A because it is cheaper, but we can’t just say it’s cheaper, we need to also explain why it’s cheaper.

Attached are several other worksheets similar to Vegas.  Each of the problems was taken directly from our textbook.  I just provided the graphs and asked the questions in a similar manner to the Vegas trip.  One of the things I really like about these worksheets is that they provide students with a graph of the situation and ask them to make some connection between the graphs and the situation they represent.

RockClimbingGym

TheInternets

The Goods:

RockClimbingGym

TheInternets

VegasGraph

My Day 1 Lessons For 2013

This year I am teaching algebra and geometry again – new school, same subjects.    I have decided to do no introduction or ice breaker activities.  No syllabus on day 1 (which I never have done) either.

Last year I did the straw bridge challenge and I loved it and definitely recommend it.  But I am scrapping it this year due to the time constraints of  focusing on CCSS in a district that is still giving the STAR test.  So I choose these two activities for their more direct relationship to standards I must teach, as well as their low entry point and interesting hooks.

Algebra

Day 1 in algebra is going to be my Getting to Vegas problem, which is simply a personalization of a problem Dan Meyer describes here.  When I was living in Forestville some friends and I decided to go to Vegas.  There are two airports that we could have used – the smaller local airport in Santa Rosa, or the larger airport in San Francisco.  Which airport should I have took, or will I take next time?  I have screen grabs of all relevant information in the slides.

A couple extensions:  How long would the Vegas trip need to be in order for the Santa Rosa airport to be cheaper?  (Eventually the more expensive parking at SFO takes over).  Or Dan’s scenario of taking a shuttle from Santa Rosa to the San Francisco airport vs. driving directly to San Francisco.

Presentations.004

The Goods:

 GettingToVegas

Geometry:

In geometry I’m starting with Dan’s Taco Cart problem.  I am just going to go to keep it as Dan vs. Ben, because I am a bit intimated on day1 to follow Fawn’s more interactive implementation allowing students to choose their own paths.

This is an exercise with the Pythagorean Theorem, which is great for day 1 because they have all seen it before.

The Goods: 

TacoCartWS

TacoCartWS

Taboo – Quadratic Functions

The Overview

Improve student literacy by focusing in on the math terms surrounding quadratic functions, and then play Taboo using those terms.

IMG_0483

The Description

Warning:  Your students will have a lot of fun with this.

Taboo is a game where you try to get your team members to say the word on your card, but there are a list of restricted words that you cannot use in your descriptions.

I read Fawn Nygun’s Taboo activity and I wanted to do it with my class.  I love how she implemented it by having her students create the cards.  But I decided to control the words in Taboo by creating the cards myself.  This allowed me to scaffold it by first focusing on improving student literacy on the words that I had put into the game.

To scaffold the words that were going into Taboo I decided to use Frayer Models.  I created the packet “My book of Frayer Models” and we did two each day for a week.  It was a warmup activity that they did when they first walked into class, probably took 20 to 30 minutes each day.  Below is an example of one of the pages of a students Frayer Model book.  I would give students the page number where the word could be found in their textbook, and I had them do the model themselves while I did the routines of checking off homework and taking role.

IMG_0487

After I was done checking homework, taking role, I would randomly call on students and get my Frayer Model completed on the whiteboard.  Lastly for each Frayer Model, I would put the word on the whiteboard and ask students for key words that describe it.   This portion of the lesson acted as my substitute for when Fawn’s students wrote out their own taboo cards.  We were essentially writing out a Taboo card as a class, and it allowed me to see what words the students deemed important.

After we finished their book of Frayer Models – It was time for Taboo!

The taboo cards focus on quadratic functions.  I didn’t make them all related to quadratic functions in order to give students the illusion that the game was covering the entire book.  The restricted words were choosen to leave the door open for good mathematical descriptions and not make the game too difficult.  Thus for the word “parabola” I didn’t include “quadratic” as a restricted word.    For me, the restricted words were really meant to try and take away the cheap clues, rather than the good mathematical clues – like for instance with the card “Domain” I restricted “Range” but I did not restrict “x” or “value”.

The rules for Taboo were basically the same as Fawn’s, but here they are:

  1. Class is divided into 2 teams, Team X and Team Y.
  2. Team X goes first: two people from Team X come up to front.
  3. Skipping a word is not allowed.
  4. Team has 1 minute to get as many right as possible.
  5. No hand gestures.

The Keynote slides attached below have a description of how I explained the Taboo game to the students.

For the final round, I was describing each card and giving points to the team that could guess it first.

The Advice:

– I would let one student volunteer to come up and I would randomly select a second student to join them.  I had students who never volunteer for anything, volunteering for this.

– Ultimately if the students knew the goal of Taboo was to work vocabulary of quadratics, then they could just list off all those key words every round.  So it’s important to do the following two things in order to give the students the illusion that any term in the book is possible.

  1. Do not tell the students that they are going to use the terms from the Frayer Models to play Taboo.  Even though every term from the Frayer Models are in the game, the students don’t need to know that.  I even collected the Frayer Models to day before playing Taboo.
  2. Throw in some math terms that do not have to do with quadratics.

– Students liked to say things like “the opposite of” – so if you have a card for maximum, make sure minimum is a restricted word.

– Use the restricted words to keep students from being able to use a non-math description.

– Have your TA cutout the Taboo cards and glue them to playing cards.

The Results:

A high level of engagement.  Definitely an animated class and everyone enjoyed the activity.  Students were shouting out a lot of great vocabulary, and I felt good that the Frayer Models had given them improved math literacy.

The Goods:

BookOfFrayerModels

QuadraticTabooCards  (There are only enough cards here for 2 or 3 one minute rounds if you have two teams)

TabooSlides

Teach/Pair/Share

The Description:

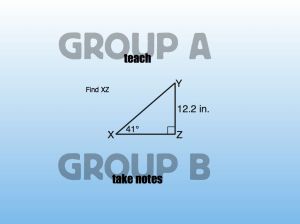
Teach/Pair/Share is my structured version of a pair/share.  It is structured more formally that the regular pair/share in that I have to be prepared to do the Teach/Pair/Share, whereas I can just have students do a pair/share at anytime without slide preparation.  The Teach/Pair/Share fits into #reasoning because it requires the students from group A to teach those in group B.

For the Teach/Pair/Share I have make sure each student has a partner, put those rows closer together, one row is group A, the other is group B.

Intially I will have one of the groups take notes, say group A, and the instruction for group B will be to listen.  I tell group B to just listen – and I make sure they do not have a pencil in their hand, because I do not want them writing anything.  Then I have group A take notes and help me solve the problem.  Once we have the whole problem on the whiteboard, I erase it, and switch the slide.

Now it is time for group A to teach group B, and for group B to take notes on what group A is telling them.  It is critical to be circulating at this point.  Randomly choose a group and ask the student in group B how to do the problem. If they explain it correctly, thank the group A students for great teaching, and the group B student for great learning.

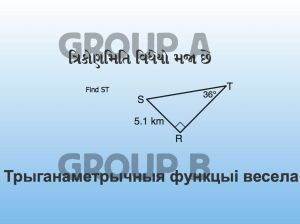
Now repeat the same steps with jobs reversed.  At the end I have one problem that everyone needs to do.  I typically google translate the instructions into a language no one knows, and then I act upset when the students do not initially know what to do.

Macro-Differentiation

These are a listing of hastags that I use to catagorize my lessons plans.  Each catagory represents a different style lesson plan.  My instructional goal is typically to make sure that I use each hashtag at least once a month.  The goal of this blog is to share all the lesson plans that I use under each hashtag.

My detailed lesson plans are my Keynote slides.  But along with those, I make a quick, calendar-style overview to me a general idea of what I am doing.  It’s on this calender where I place the hashtags at the bottom of each day.  This allows me  to quickly look back at what I have been doing, and know whether of not I am differentiating.  For example, here is two weeks worth of my lesson plans in geometry.  Notice that I can quickly see whether or not I have differentiated my instruction, without having to analyze each specific lesson plan.  The hashtags allow me to get a quick sense of what I have been doing, and what I have not been doing.


*Notes –

-The term “perplexity” is being used as described by Dan Meyer here