Category Archives: worksheets

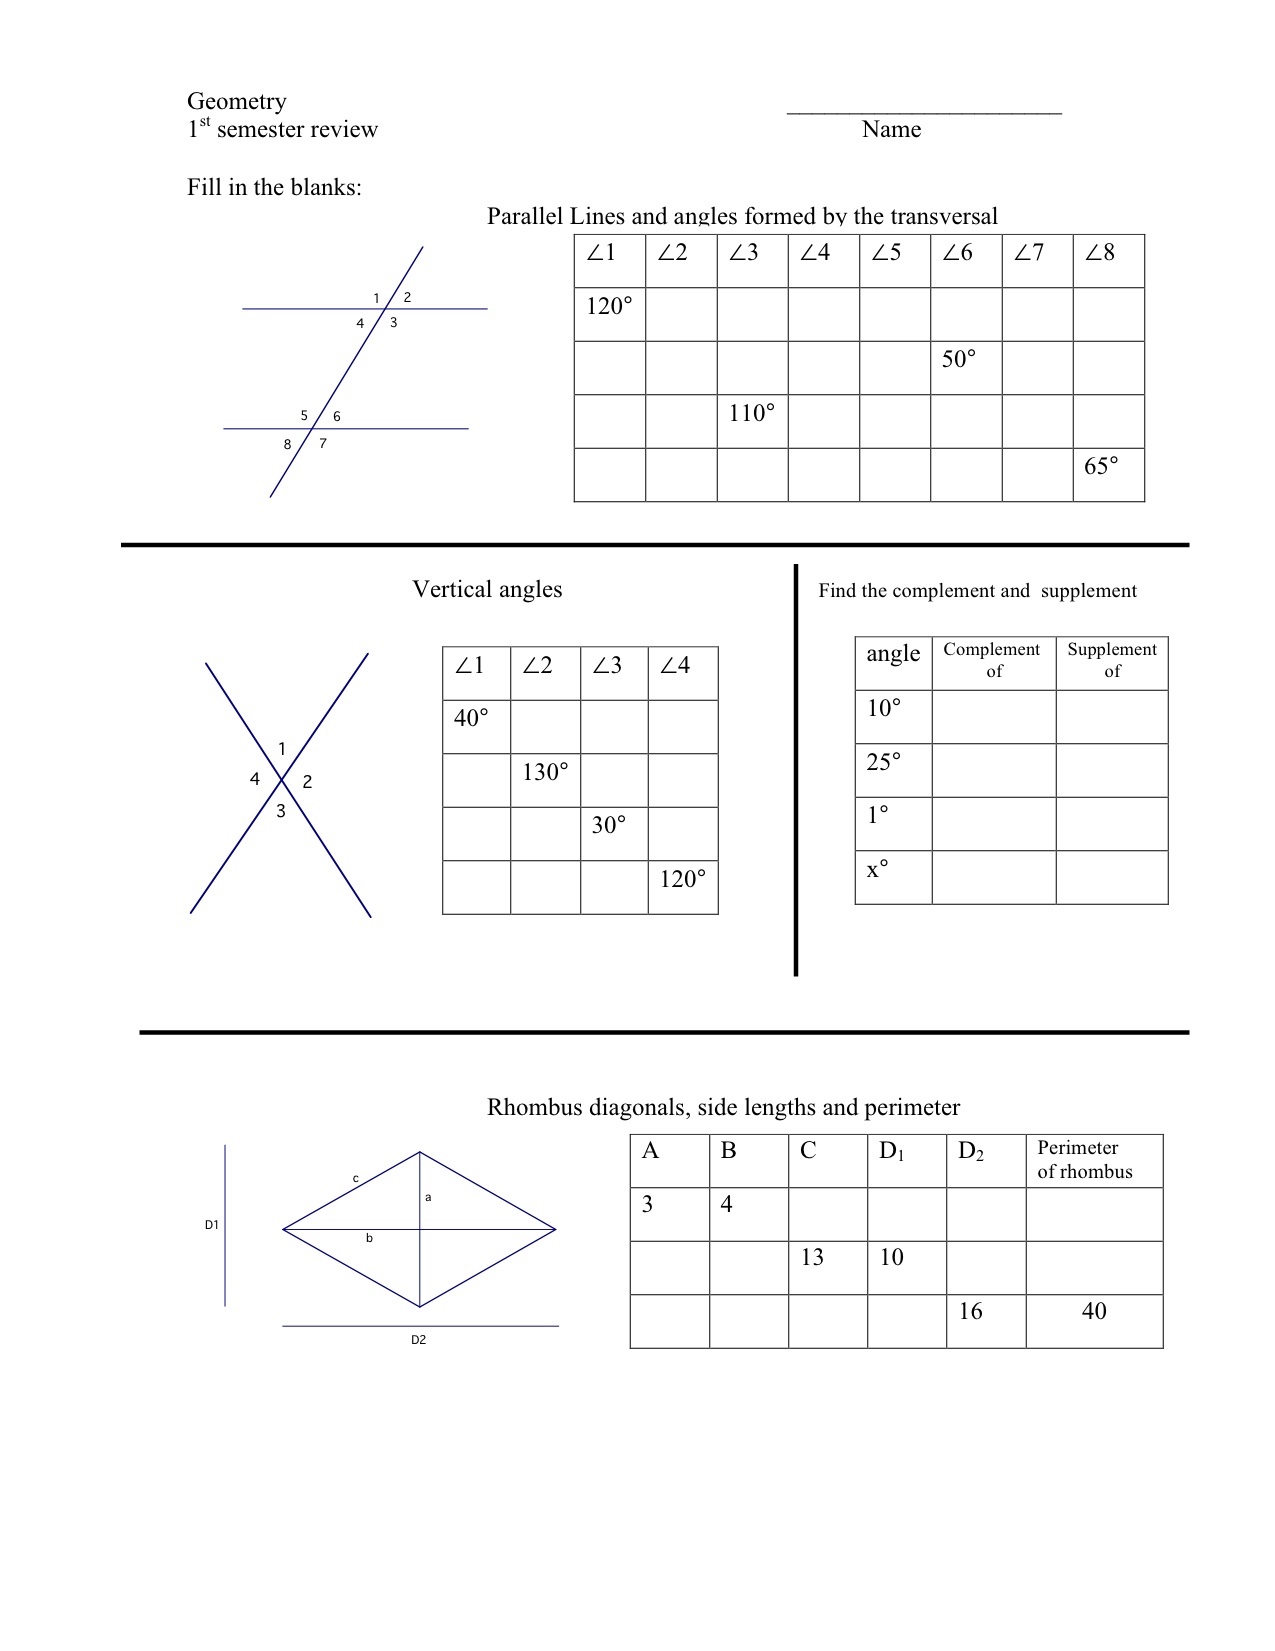
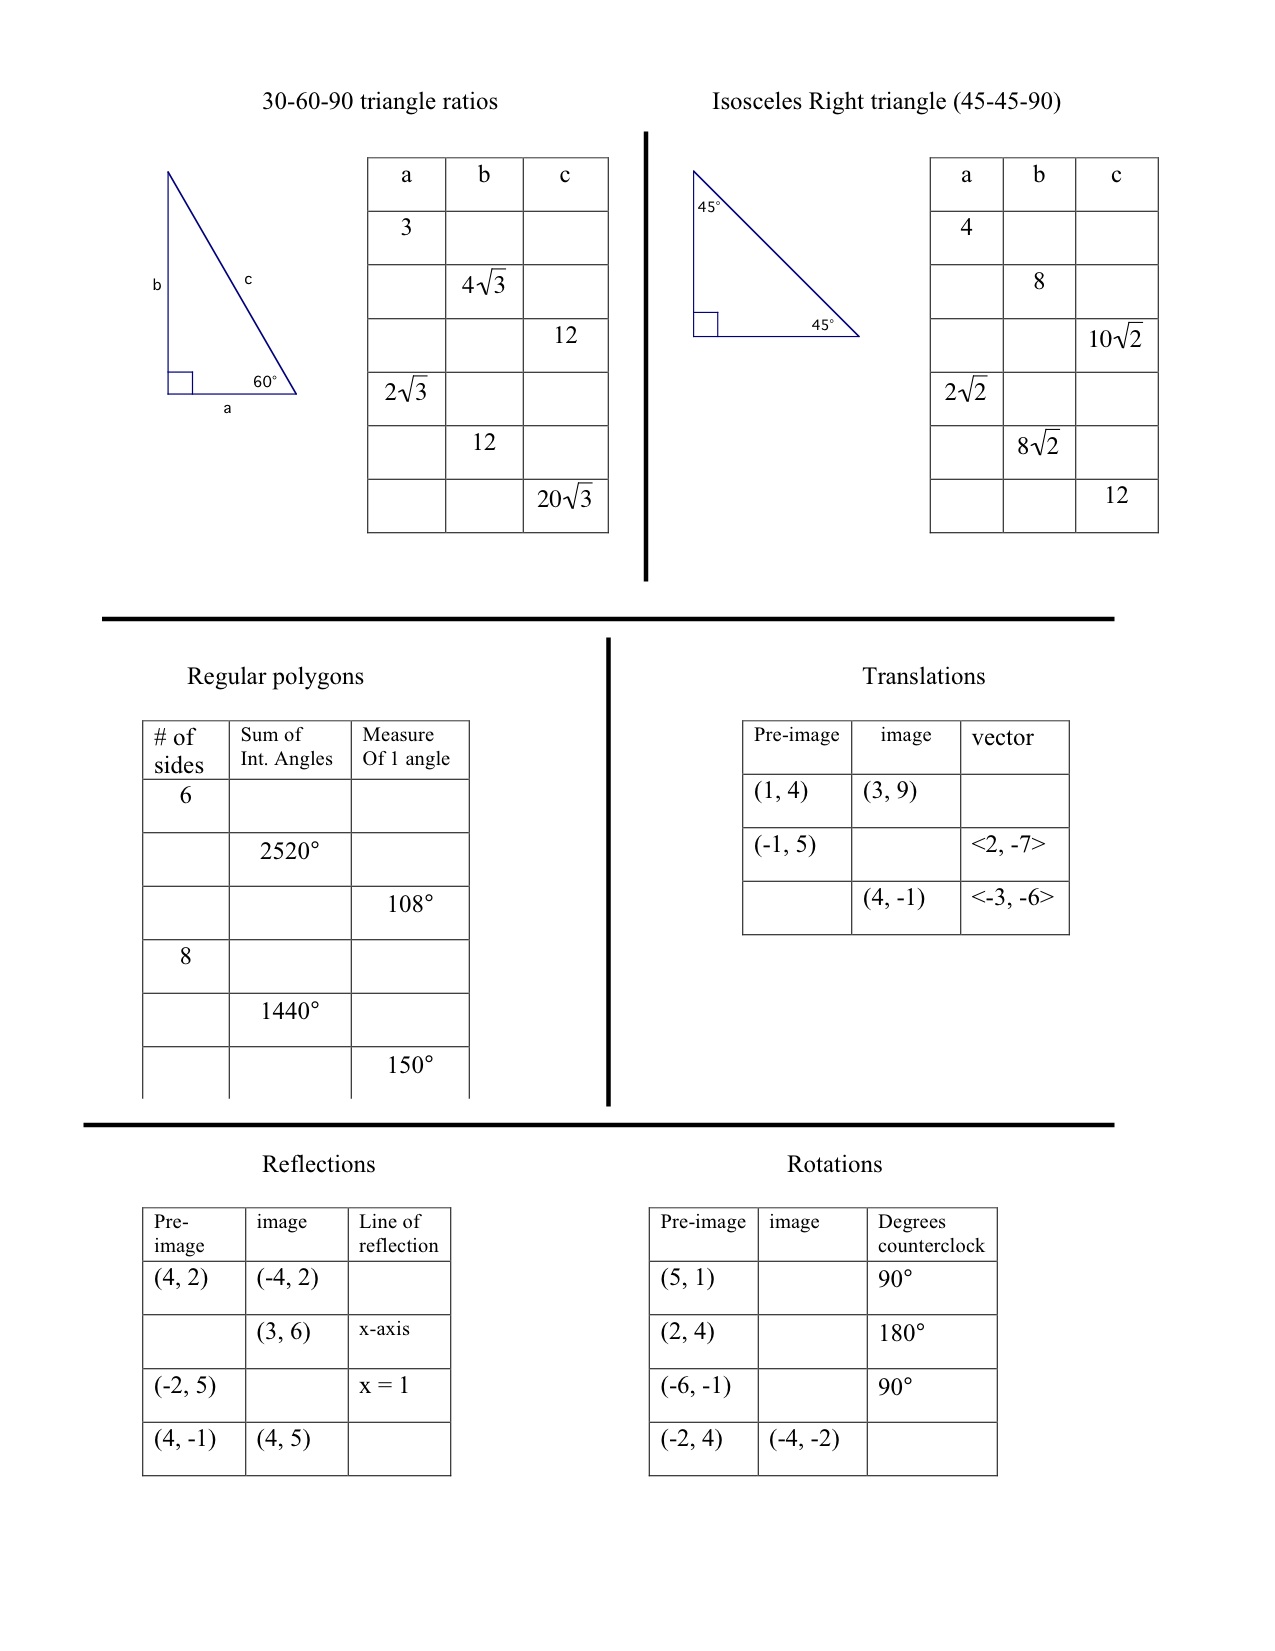
Geometry – First Semester Review Worksheet

I know there are some people out there who could use this.  Especially as finals near.  It covers parallel lines cut by a transversal, vertical angles, complementary / supplementary, rhombus, special right triangles, polygon interior angles, and transformations.

1st sem review chart2

1st sem review chart

This was created by my colleague Dave Casey – who is definitely at the top of my “I wish they had a blog, were on Twitter, and were presenting at conferences” list.      This is just one of his worksheets – you should see his activities, amazing stuff.

The Goods (aka: the pdf)

1st sem review chart

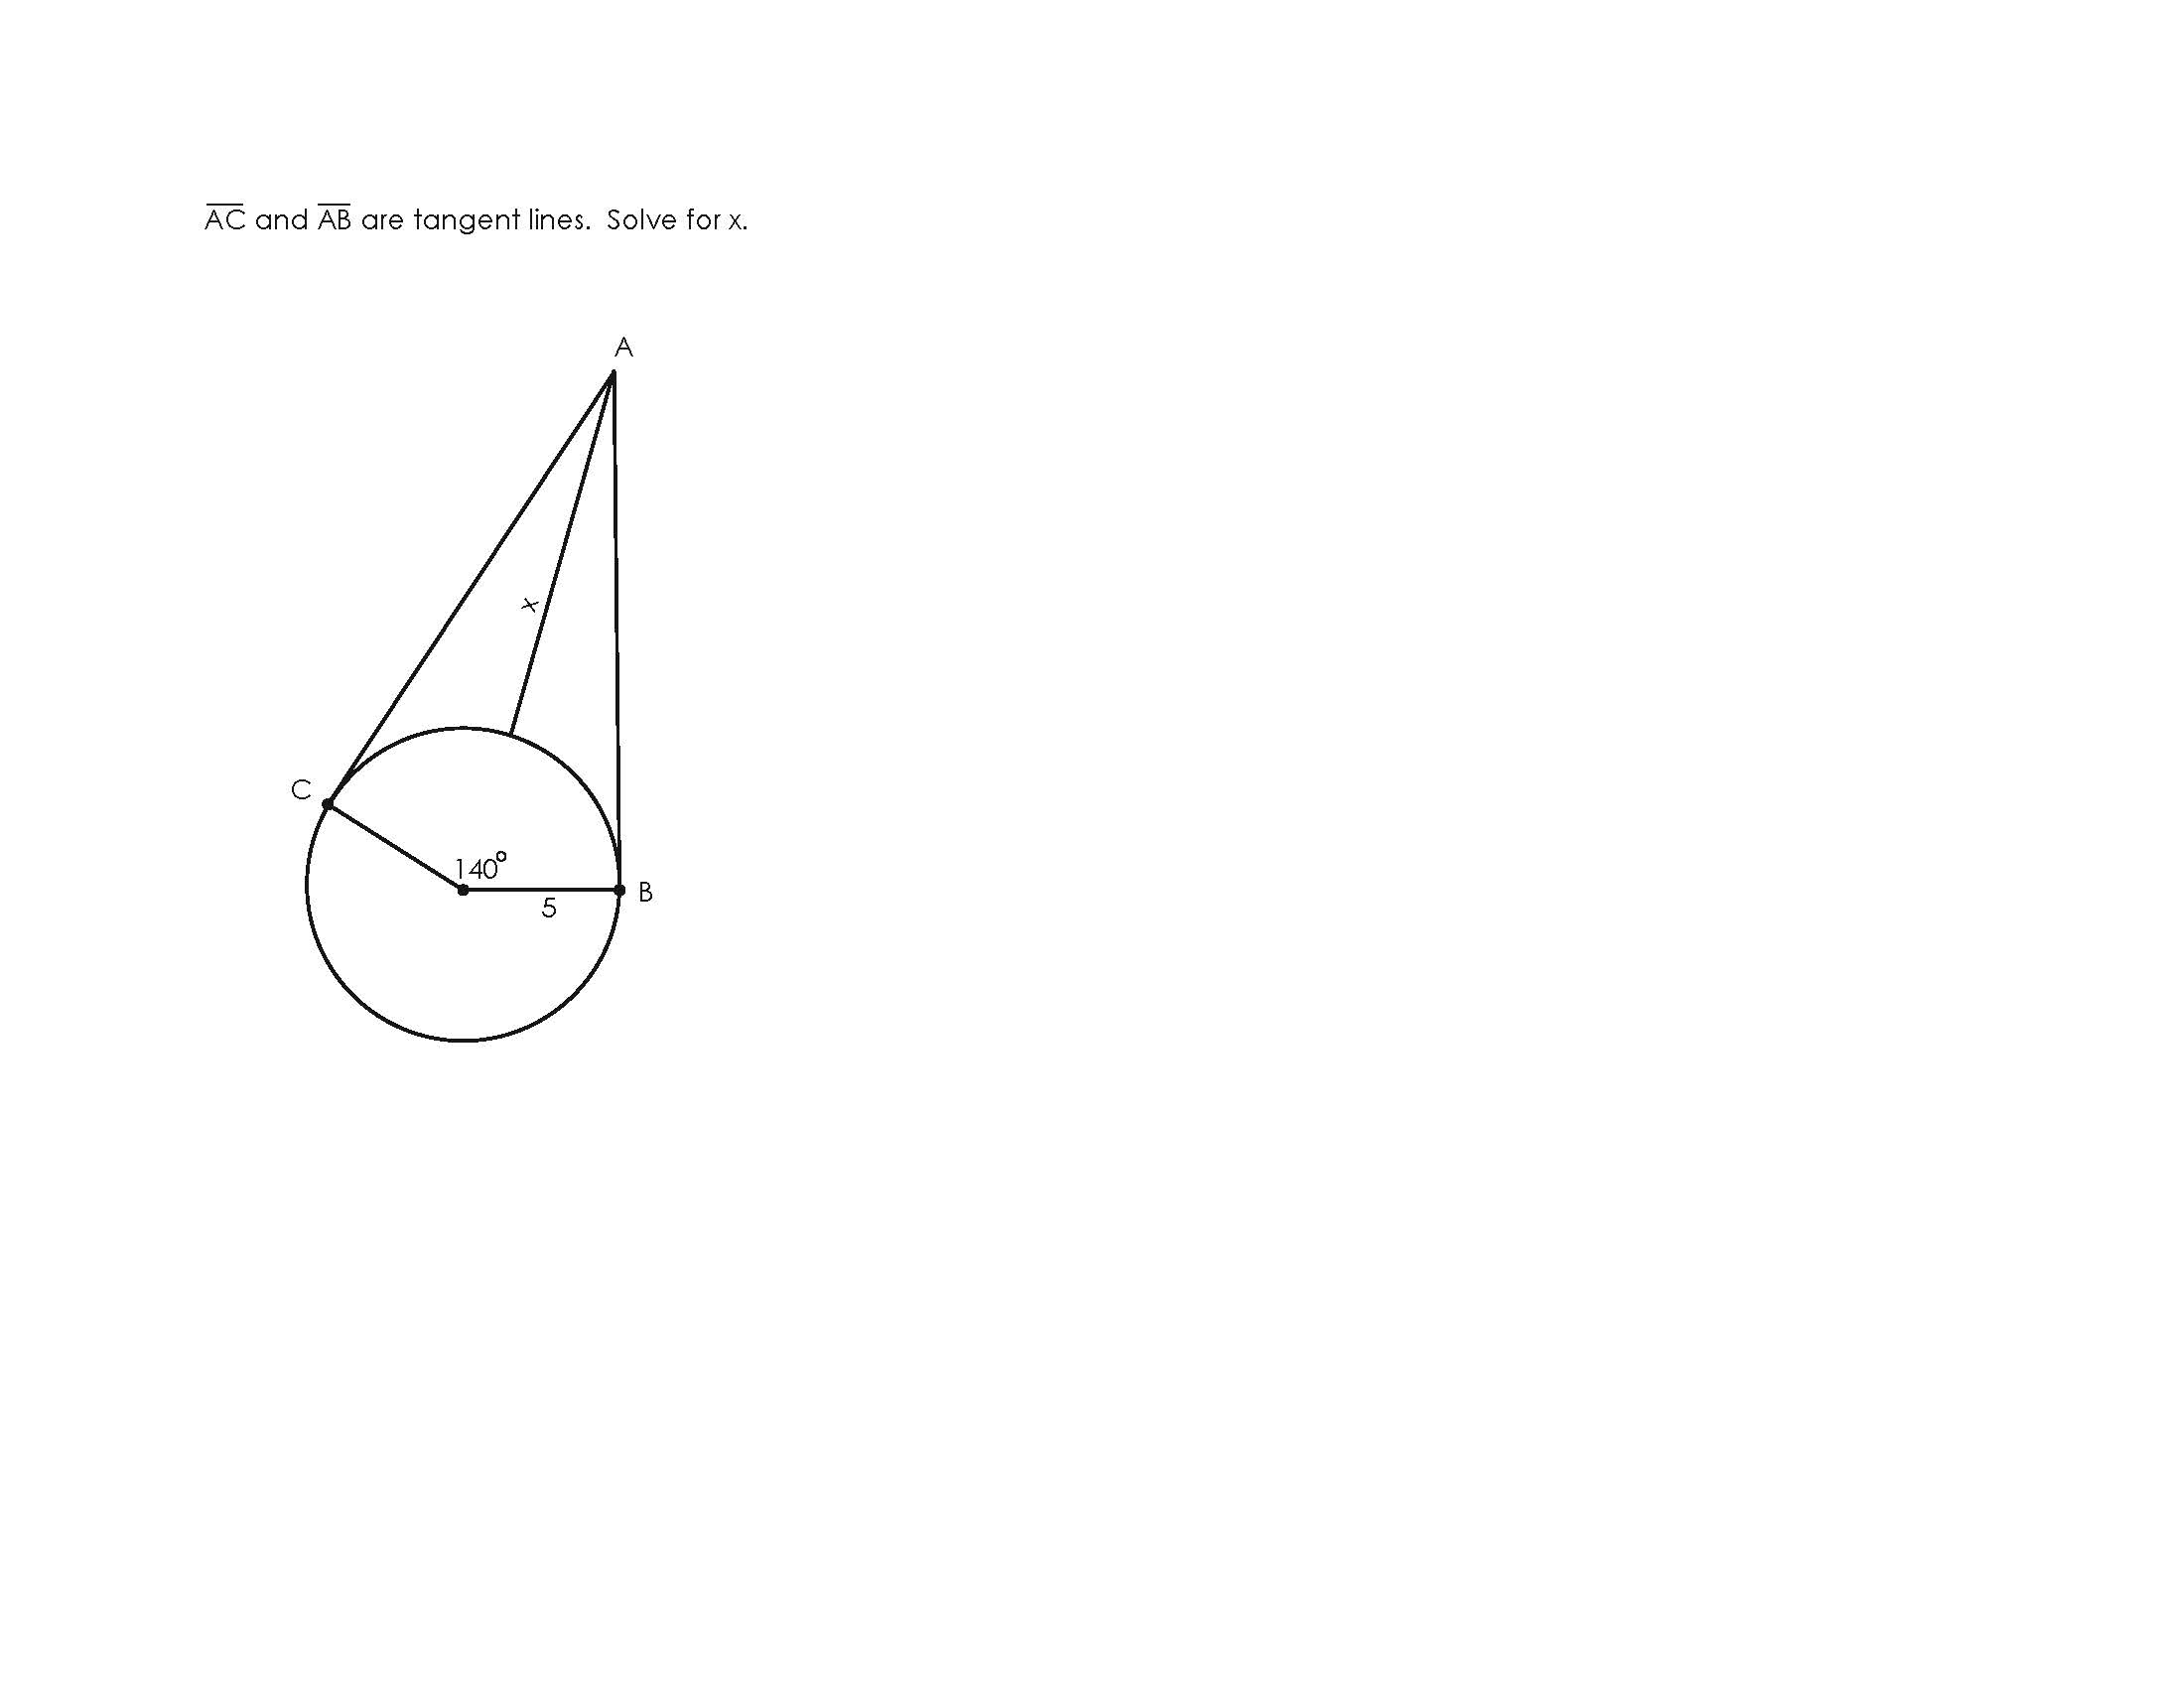
Tangent Line and Circle Problems

I will categorize this post as “sometimes you just need a worksheet”.  #SYJNAW for my twitter peeps.

I have always kind of disliked teaching the circles unit in geometry because of all the different rules – tangent / secant angles, chord-chord sides, chord-chord angles, blah blah.  This year I put together a learning segment on circles that involved satellites in geostationary orbit.  It was based on my experiences working at Lockheed Martin and my engineering background.  I will write about it when I have time.  But for now I will just attach a couple worksheets I made of problems that I put on a homework, or threw in a test. I figured I would just share these, because you know… some times you just need a worksheet.

These problems themselves involve tangents, central angles, and trig functions.  The actual learning unit is very similar, but requires the students to contextualize and decontextualize.  So without further comment – here’s some of the practice problems I used:

SatelliteGenQ1

SatelliteGenQ2

SatelliteGenQ3

The Goods: (sorry I only have pdf’s, I create things with Adobe Illustrator)

SatelliteGenQ1

SatelliteGenQ2

SatelliteGenQ3

Missing Assignment Buyout Program

The Overview:

This year I wanted to do Kyle Pearce’s Detention Buyout Program that Dan had highlighted in his Great Classroom Action series.  The problem was that in my new school we don’t have detentions, so I didn’t think I would get much buy-in from the students.  But there is something that all schools definitely do have:  Missing assignments!  So I created three “deals” that would allow students to pay me money in exchange for getting credit for an assignment they missed.

I used this assignment as an introduction to inequalities, but I also wanted to link the Missing Assignment Buyout Program to the linear equations we just finished covering.  That is the why as you look at this assignment, you will see a focus on connecting the information in the graphs to the information contained in the inequalities.

I sequenced this by first giving the assignment.  Then two days later I did another version of it as an opener / warmup.  And then lastly I put another version of it on their test.  Each new version offered slight modifications from the previous.

The Description:

I first offer students three possible deals for buying off their missing assignments.  I poker face the whole thing and enjoy all the “Is this legal” expressions on their faces.  I tell them to make sure they go home and talk to their parents about how much money they have budgeted for such as program.  The first question on the worksheet asks them which deal is better for them, so as an added bonus I printed out each students missing assignments and handed it to them.  This is that first worksheet:

MissingAssignmentBuyoutProgram_Page_1

MissingAssignmentBuyoutProgram_Page_2

There are a lot of interesting questions and explanations that came out of this first assignment.  For instance, having students see that x less than 5 was the same as saying x less than or equal to 4 since x could only take integer values.  Also having students see the connection between the intersection points of their graphs and the inequalities they wrote was time well spent.

A couple days later I came back to the Missing Assignment Buyout Program in the form of a opener or warmup question.  I handed the students this graph when they came into the room (two graphs per page to save paper):

MissingAssignmentBuybackProgramOpener

Then I had students write a description of each deal, as well as the inequality and equation for each deal.  This was a slight inversion of the original assignment where I gave them the description and had them write the inequality, equation, and then graph.  Now I am giving them the graph and asking them to write the description, inequality, equation.  I have them in pairs and am checking homework and taking role while they work.  Then I randomly call on pair share partners and fill in the following table that I am projecting on the board:

Screen shot 2013-11-27 at 5.18.48 PM

Lastly to make sure that they really did understand the concept, I put a similar problem to the opener exercise in their inequalities chapter test.  The test had a slight twist in a scenario where a student would want to buy the Flat Fee plan based on their number of missing assignments, but based on the money they had to spend, they would need to pick their second best option.  Here’s that problem:

MissingAssignmentBuybackProgramTest

I initially thought having them graph each deal was kind of an unnatural excercise, because why would someone ever graph something like that?  But I think it ended up working because of how the Opener and Test question both refer to the graph.  All in all student engagement was high, even with the graphing portion so I think I’ll keep it next year.

The Extension:

(good idea courtesy of my principal)

Tell the students that you have decided to only offer one deal to the whole class, and they have to decide which deal they want for the class.  This could open up a nice debate about fairness and equity – this deal is best for you since you don’t have any missing assignments, but what about these other students?  Connect this debate to something current, like Obamacare.  Discuss how math influences decisions and that often decision makers have to make decisions based on their believe on the greater good, even when the numbers indicate that some people will be negatively affected by the decision.

The Goods:

MissingAssignmentBuyoutProgram

MissingAssignmentBuybackProgramOpener

MissingAssignmentBuybackProgramTest

The Centauri Challenge

I’m posting this because my students enjoy it and I can’t find it anywhere online.  I got it from a colleague a few years ago.  I have no idea where it originally came from.  It’s is a great intro to logic and proofs.

CentauriChallenge

CentauriChallenge

My Attempts At CCSS Word Problems

I’m trying to prepare for CCSS, so this year I have been looking at word problems with a specific goal of improving student literacy by connecting each problem to graphs and having students explain their solutions.  Then afterwards coming back to their solutions and analyzing them and improving them.  It’s been successful thus far based on my last assessment so well the hell – figured I share.

I started on day 1 with my Las Vegas Problem.  Then on day 2 I played this video of myself graphing the equations we wrote on day 1 for the two airports.

[youtube=http://www.youtube.com/watch?v=Ir1EHue9qIE&w=420&h=315]

Then I passed out this worksheet and have the students try to figure out why Wolfram Alpha was calling 14 the “solution”.

VegasGraph

I like the worksheet because it has the students try to explain which graph is for which airport, and this is before we have learned to graph or talked about things like y-intercepts and slopes.  It is just them connecting the story to the picture of the story.  The last problem on the worksheet was meant to highlight that context drives the graph, and that this particular graph should not have any negatives because you can’t have negative days.  But we had a good discussion there.

Since this is day 2 and these students aren’t used to having to “explain” their reasoning, I got a lot of papers that gave an answer without any explanation.  So I went back and did a Math Hospital and had the class analyze how to explain their solution.

MathHospitalVegas

During the Math Hospital I introduced them to one of the English languages most powerful and poetic words: “because”.  I showed that all they have to do is put that word after their solution and it will literally force you to state the reason for the answer.  CCSS literacy for me isn’t about having the students explain their thought process, rather it is about having the students explain why they made the decision they did.

I did a couple worksheets that were styled like the Vegas one and then I put one of them on Ch1 test (The Internets was on the test).  Every single student explained their answer on the exam.  After the test the class and I did the “Math Gym” where we take their healthy answers and make them healthier!  Basically teaching students that it’s great to choose internet company A because it is cheaper, but we can’t just say it’s cheaper, we need to also explain why it’s cheaper.

Attached are several other worksheets similar to Vegas.  Each of the problems was taken directly from our textbook.  I just provided the graphs and asked the questions in a similar manner to the Vegas trip.  One of the things I really like about these worksheets is that they provide students with a graph of the situation and ask them to make some connection between the graphs and the situation they represent.

RockClimbingGym

TheInternets

The Goods:

RockClimbingGym

TheInternets

VegasGraph

Parabola Review Worksheet

I created the following worksheet to help students review what they learned about identifying the different characteristics of a parabola.

ParabolasCharacteristics

After printing it out I decided that I wanted to make it an error analysis exercise instead, so I filled it out myself and made one or two mistakes for each parabola.   I had students put check marks by the correct answers, circle and fix the wrong answers.  Here’s that worksheet:

MathHustlaError

The Goods:

ParabolasCharacteristics

ParabolaCharacteristicsError

‘Who Am I’ Worksheets

The Overview

I have been making more of these “Who Am I” style worksheets where the students are given a set of clues and possible answers, and they need to figure out which answer works for which clue.  I would consider this a graphical organizer and a puzzle activity, since all the information is already organized, and the students are making connections between the answers and the clues.

The worksheet for graphing slope intercept has exactly one right answer for each clue.  The one for classifying polynomials has a couple right answers for some of the clues.  I think my next “Who Am I” worksheet will have some answers that do not fit any of the clues, which will take away any process of elimination technique the students may be using.

WhoAmIClassifyingPolynomials

The Goods

WhoAmI_SlopeIntercept

WhoAmI_ClassifyingPolynomials

Congruent Triangles Worksheet

The Overview

Here are two worksheets I created for triangle congruency – one of them is focused soley on SSS, the other on SAS.  Both worksheets begin with two problems where all the information necessary is given in the diagram, then they have two problems where the students need to identify a piece of inherent information, and then two problems where they need to intrepret both inherent and given information.  Then the last three problems are a combination of those.

The Method:

I first put the worksheet into Keynote so I can setup my timers and have my board look like their worksheet.  After that, this is my general recipe.

  1. I do the first problem on the board myself.
  2. I put up a 1 – minute timer and have the students work on the second problem.
  3. After that minute is done, I have them share with their pair share partner.
  4. I pull a popsickle stick and call on one group to come to the board and work the problem.
  5. I then repeat this process again – where I do problem 3, they do 4.  I do 5, they do 6.  Then I have them finish the worksheet on their own.

The Goods:

SSS

SAS