Category Archives: #perplexity

Adding Value – A Starbucks Lesson

This lesson could be better – but it was my first shot at it. I still definitely recommend it because of the great math conversations we had around convenience and adding value. Here’s the driving question I used:

What is Convenience Worth?

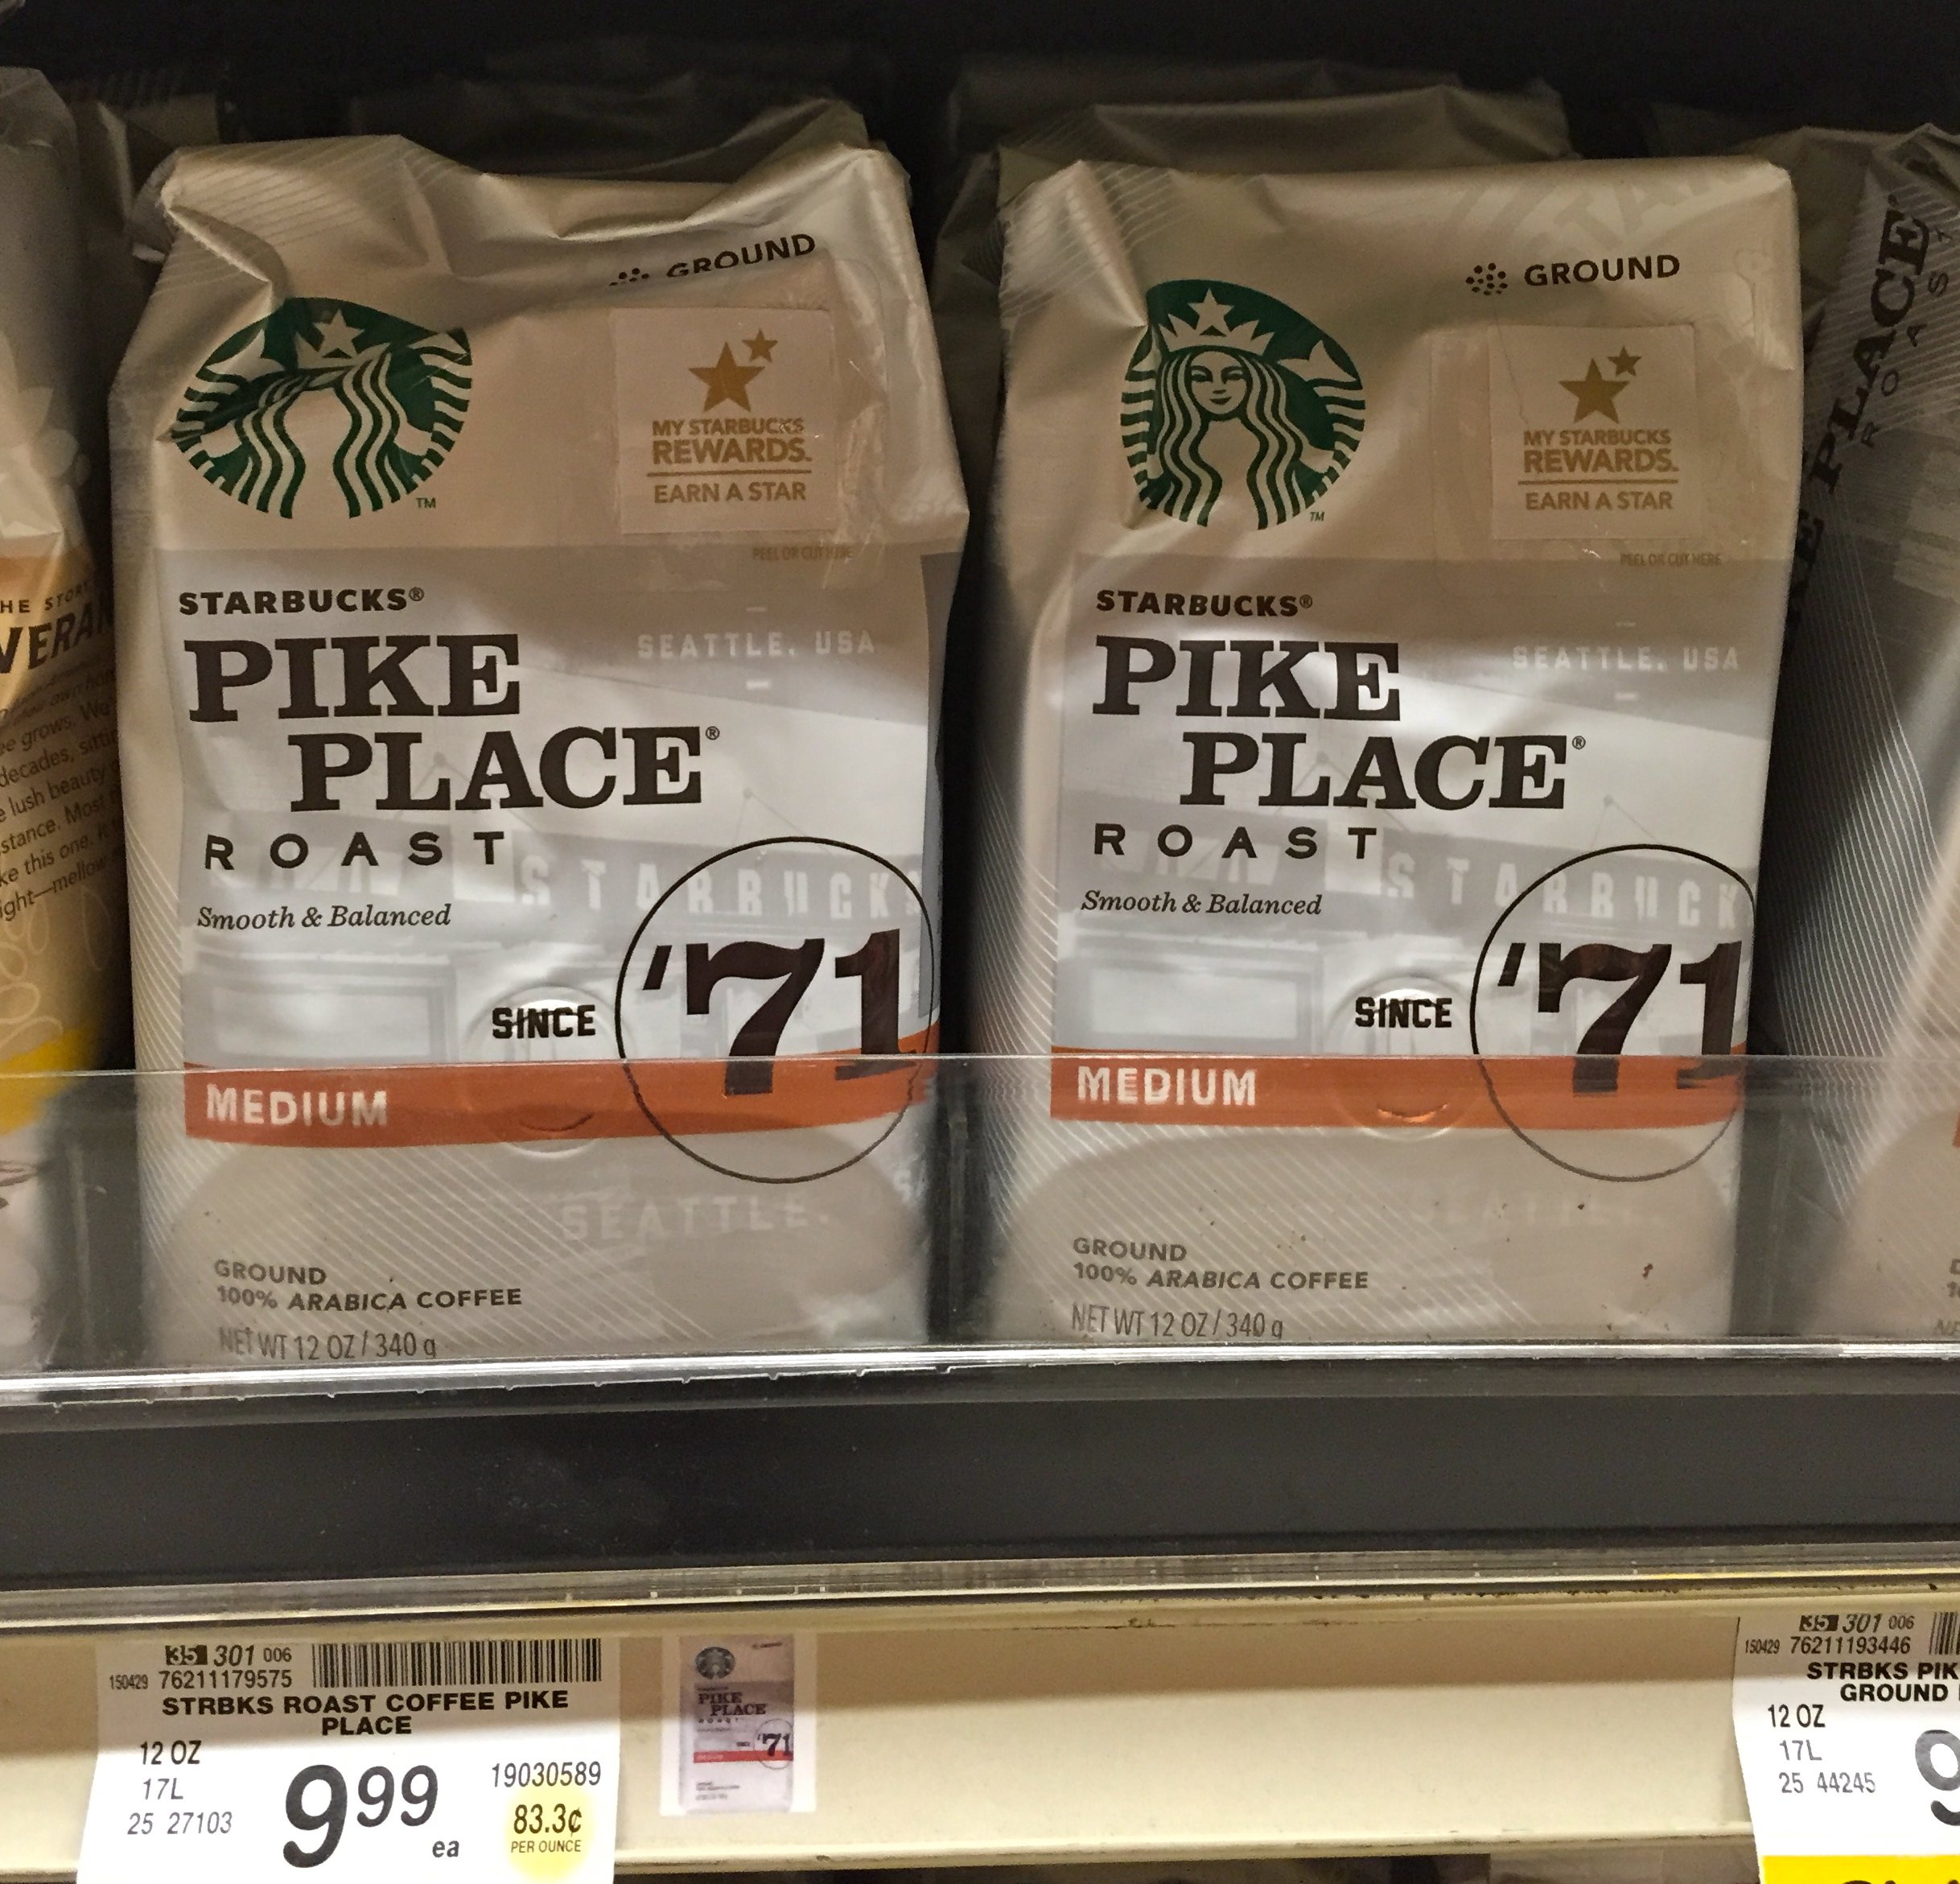
But it didn’t work as well as I wanted it to because we were really only looking at the convenience of the k-cup vs. ground coffee vs. going to a coffee shop.  It’s a cool driving question, but not necessarily the focus of this lesson.  This lesson is based more on “adding value” – where value is defined as what people are willing to pay for.  Starbucks added value to it’s coffee grounds by putting them into K-cups, and that is why they are able to charge more for it.  So how much value did they add?

So here’s the lesson:

Angle 1:  K-cups vs. Ground Coffee

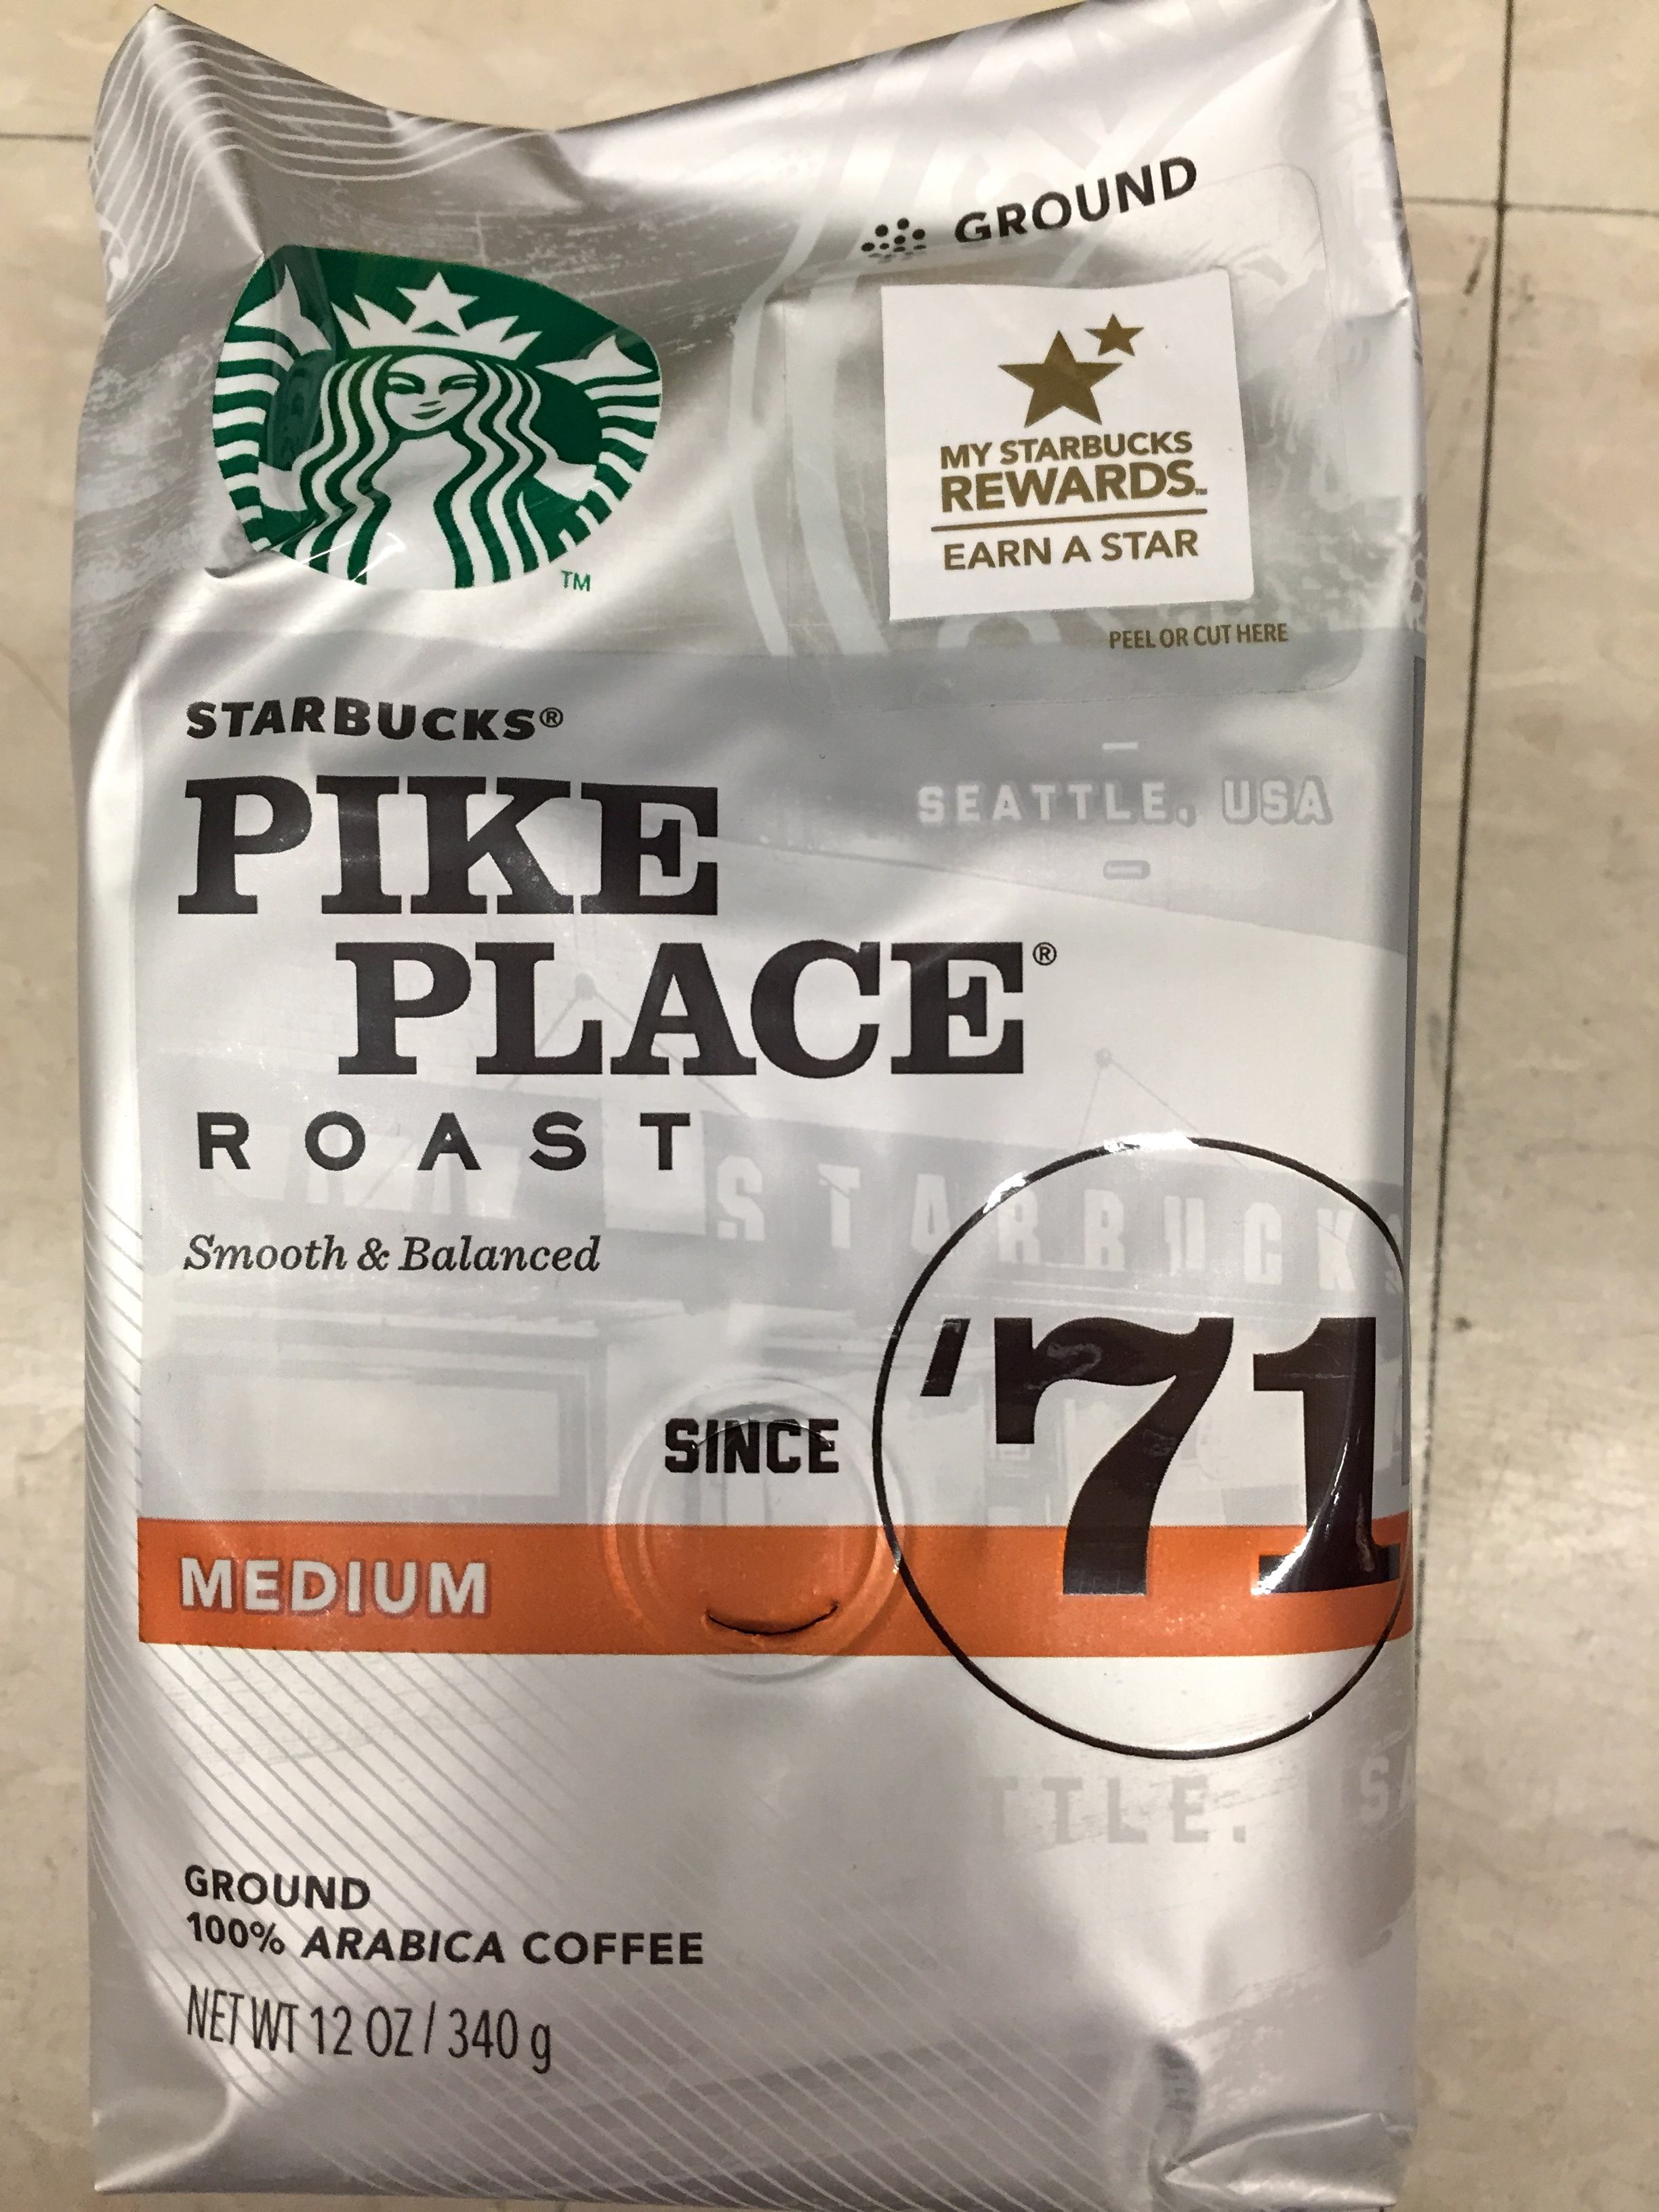
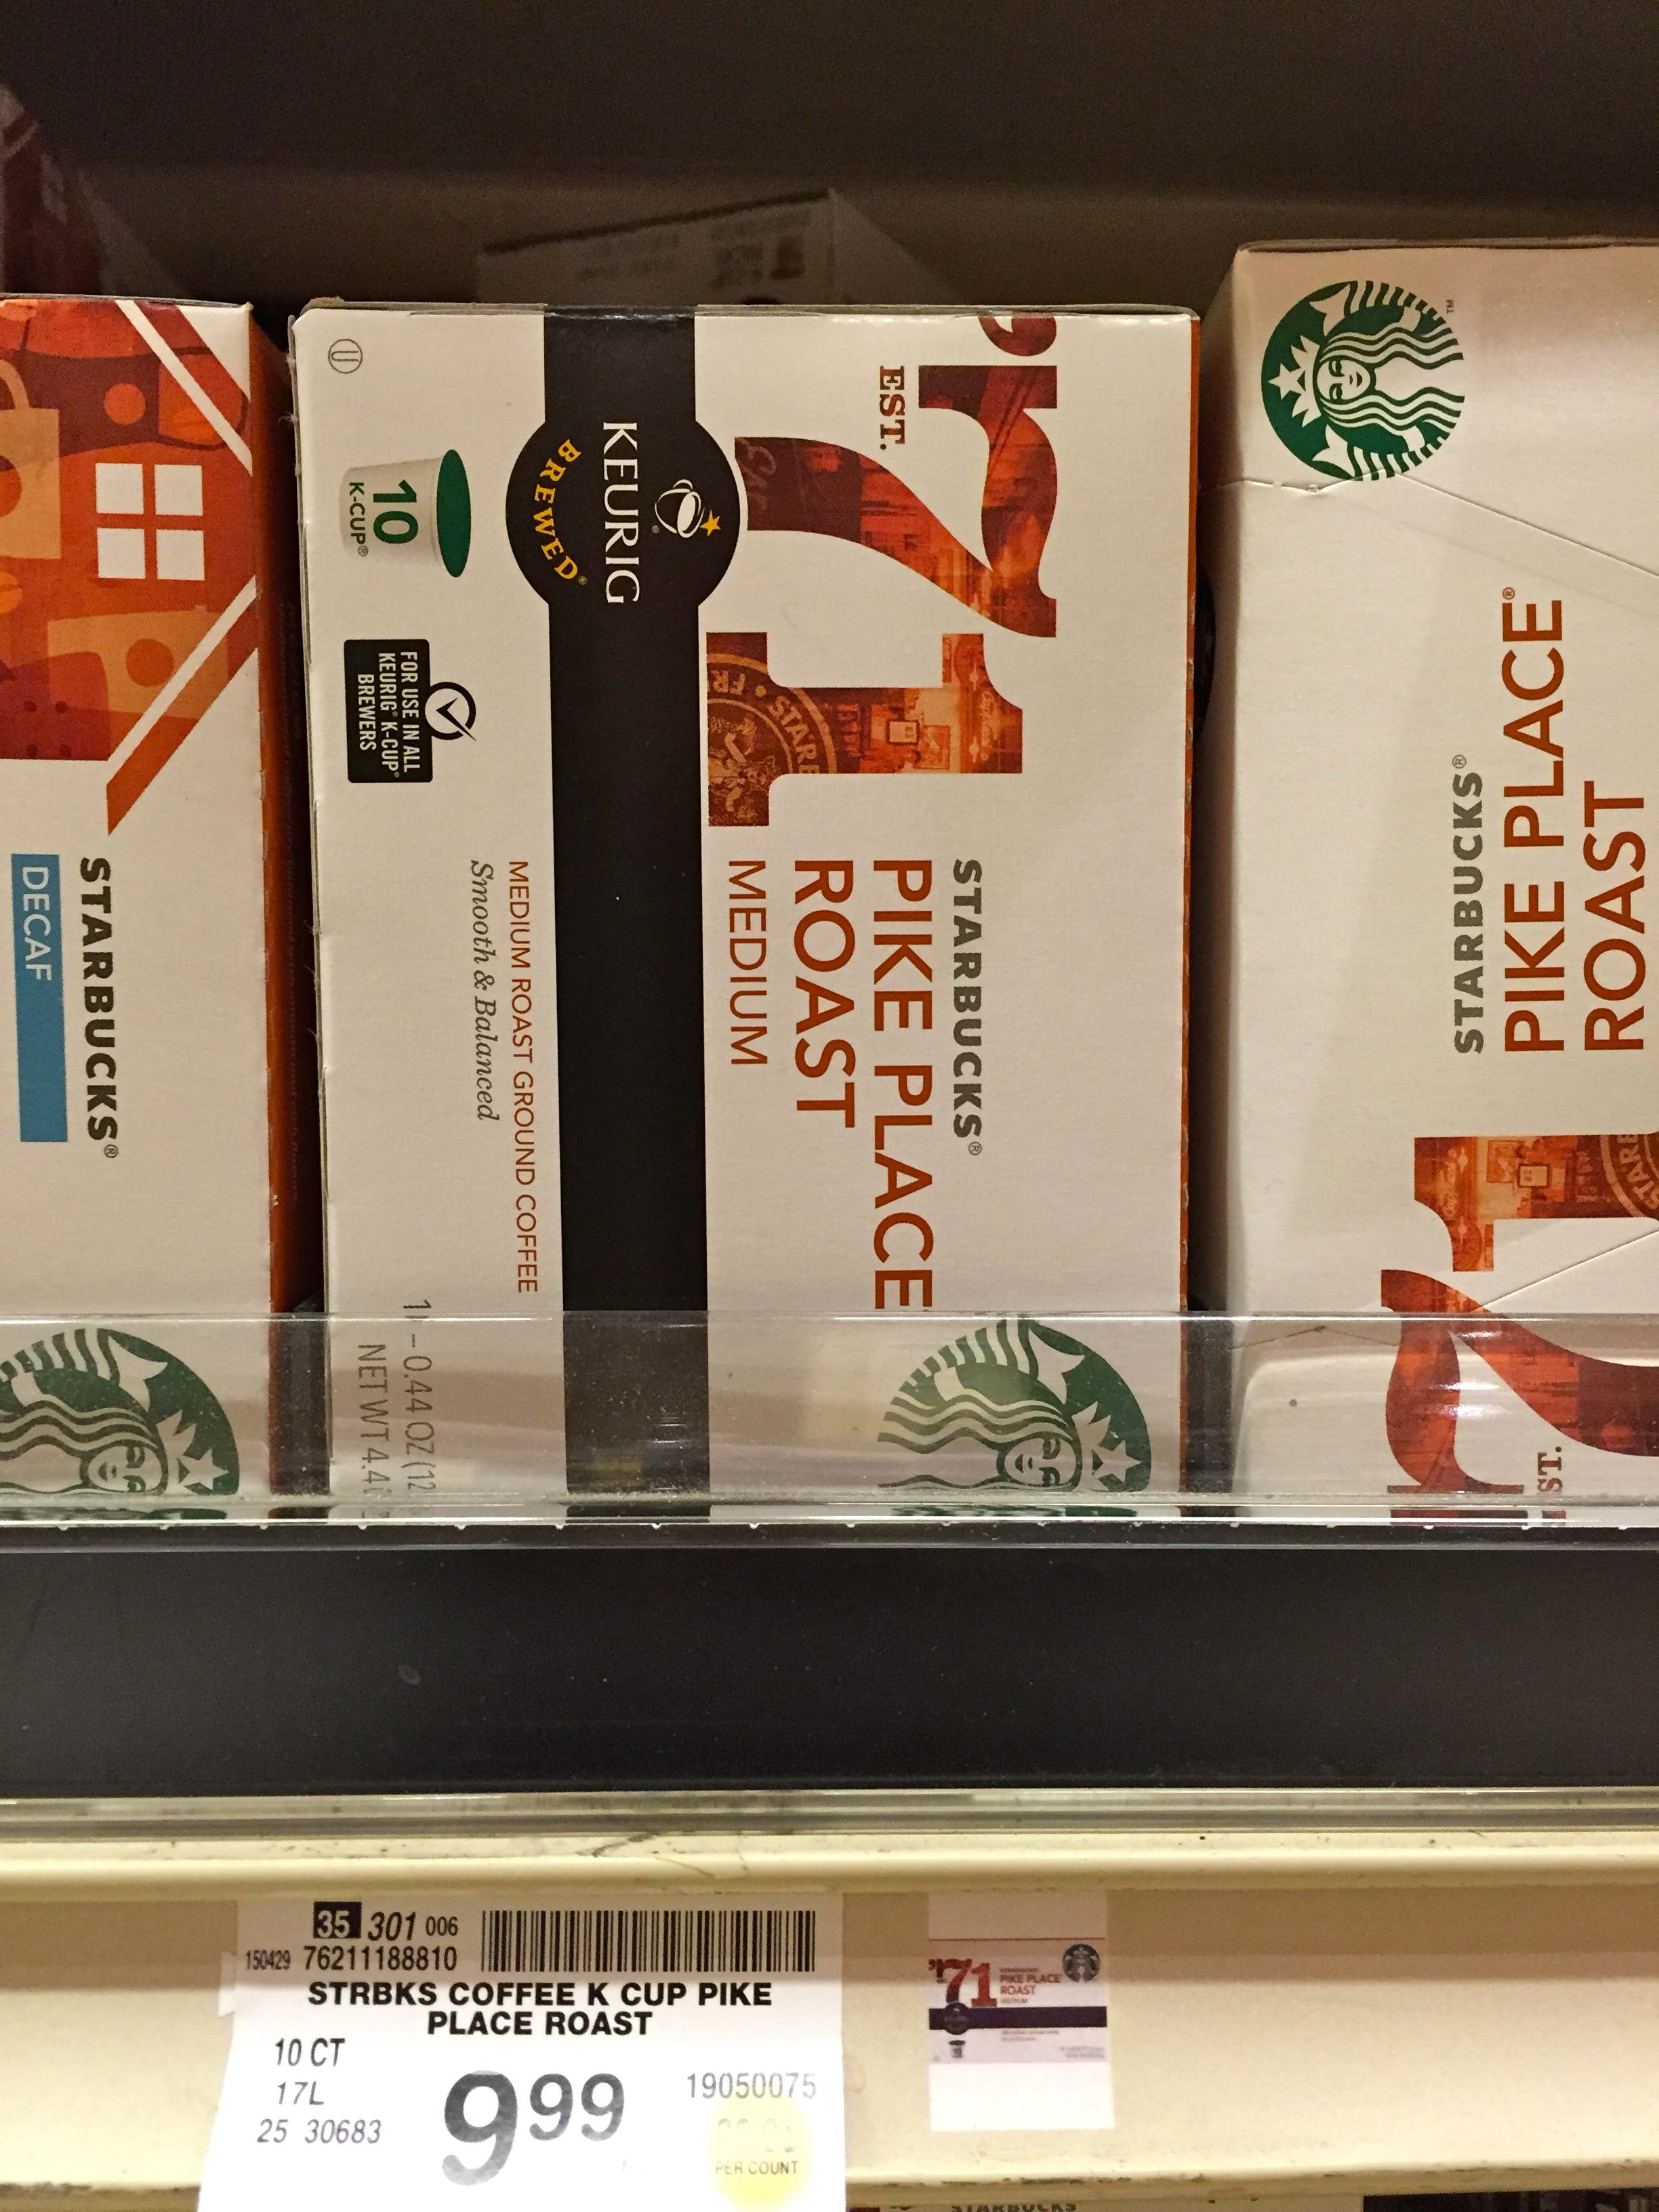
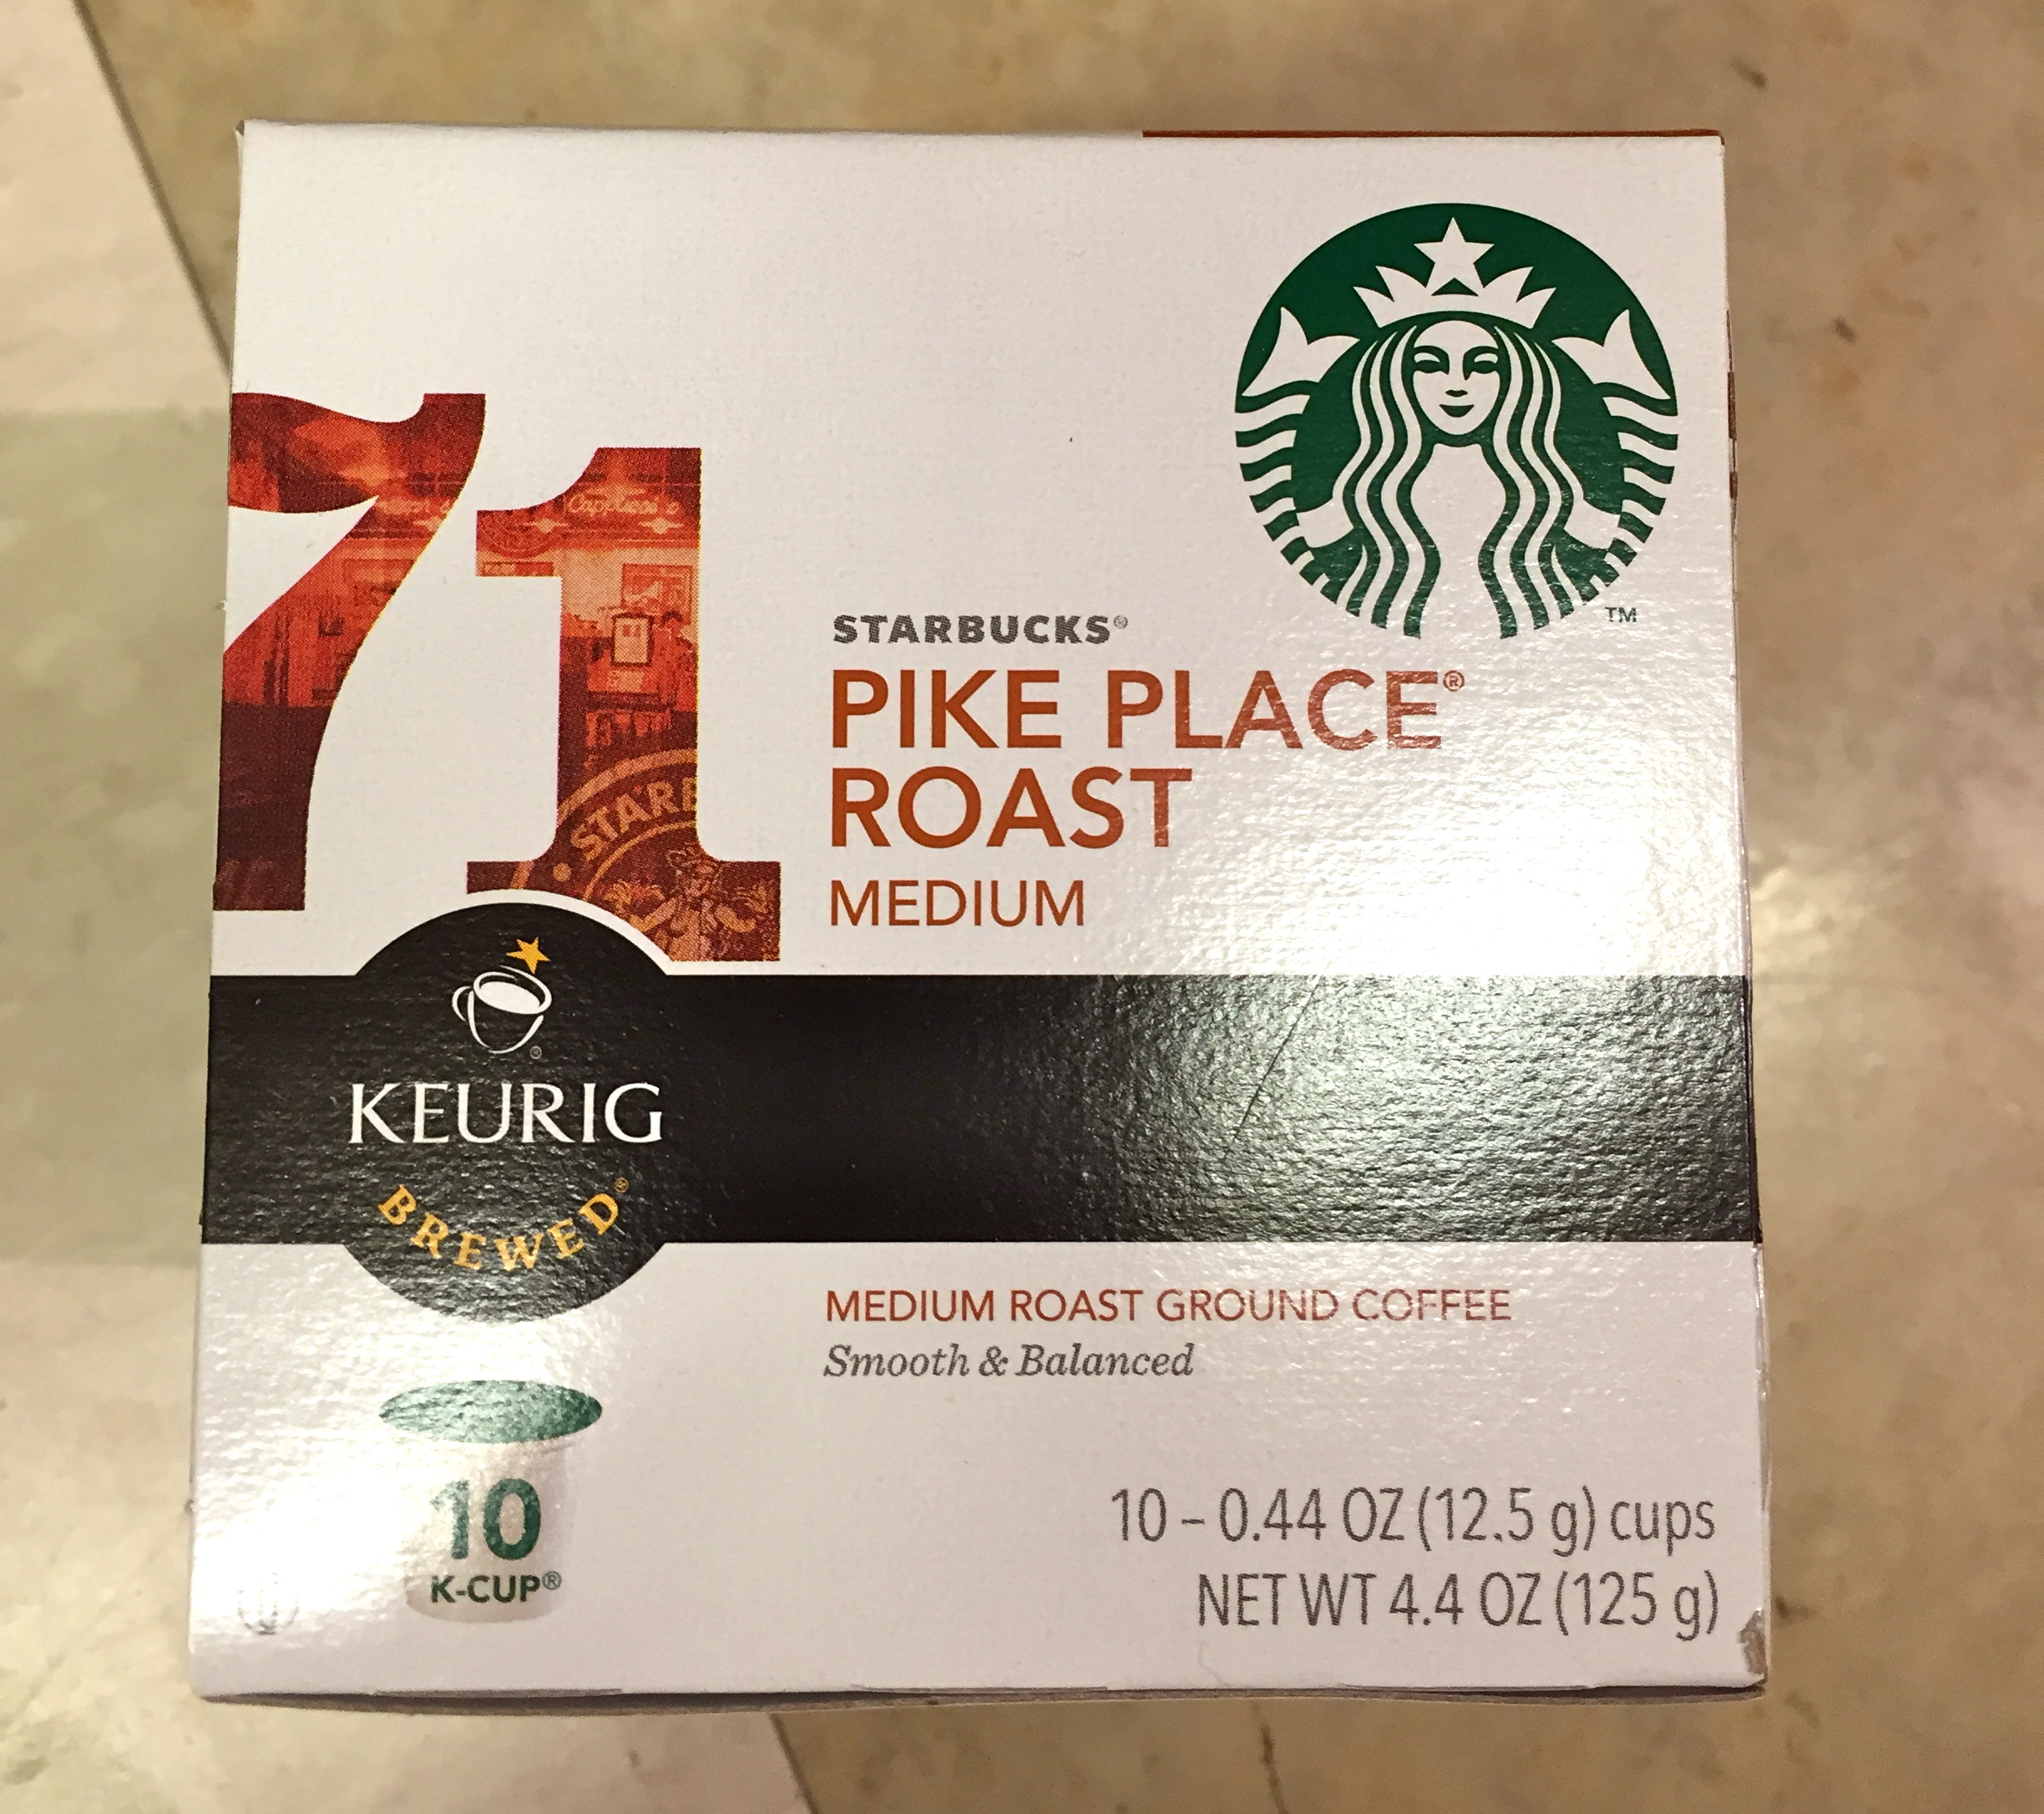
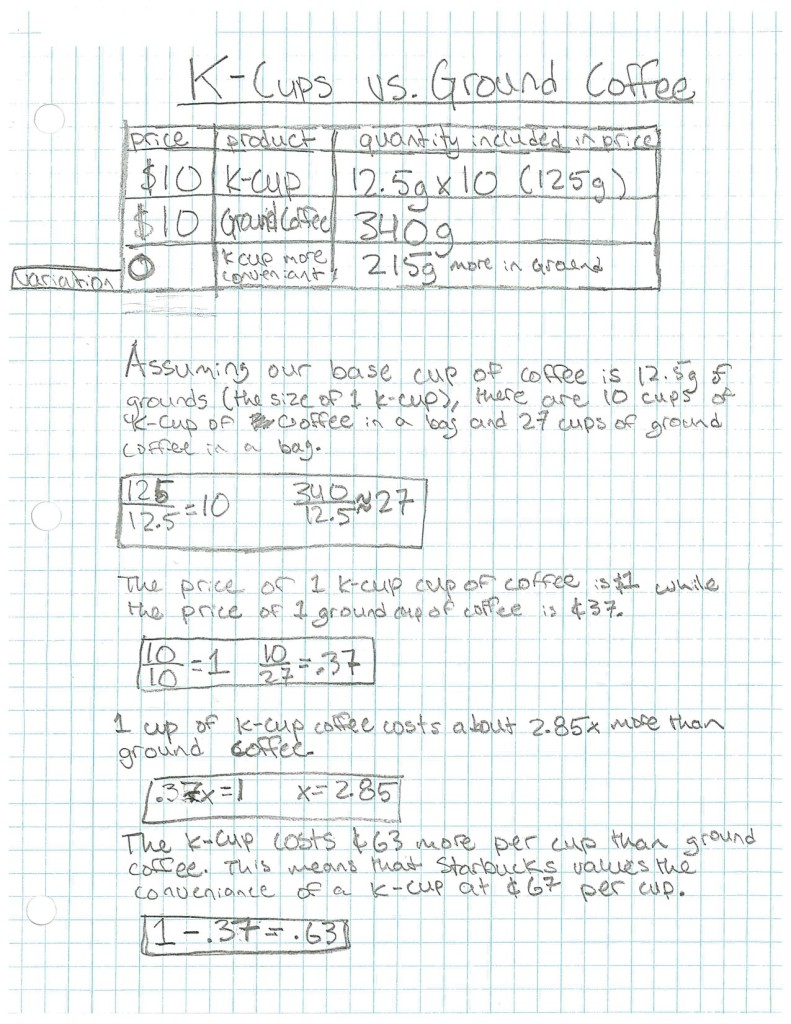
Starbucks makes K-cups and ground coffee, and both sell for $10!  [excellent] So are they the same price?  The K-cups are a package of 10, 12.5 gram cups.  And the ground coffee is in a 340g bag.  Starbucks is able to elevate it’s price for K-cups because they are more convenient than traditional brewing methods.  So what’s the value of that convenience?

IMG_2741

IMG_2742

IMG_2732


IMG_2733

Angle 2:  Coffee Shop vs. Brewing At Home

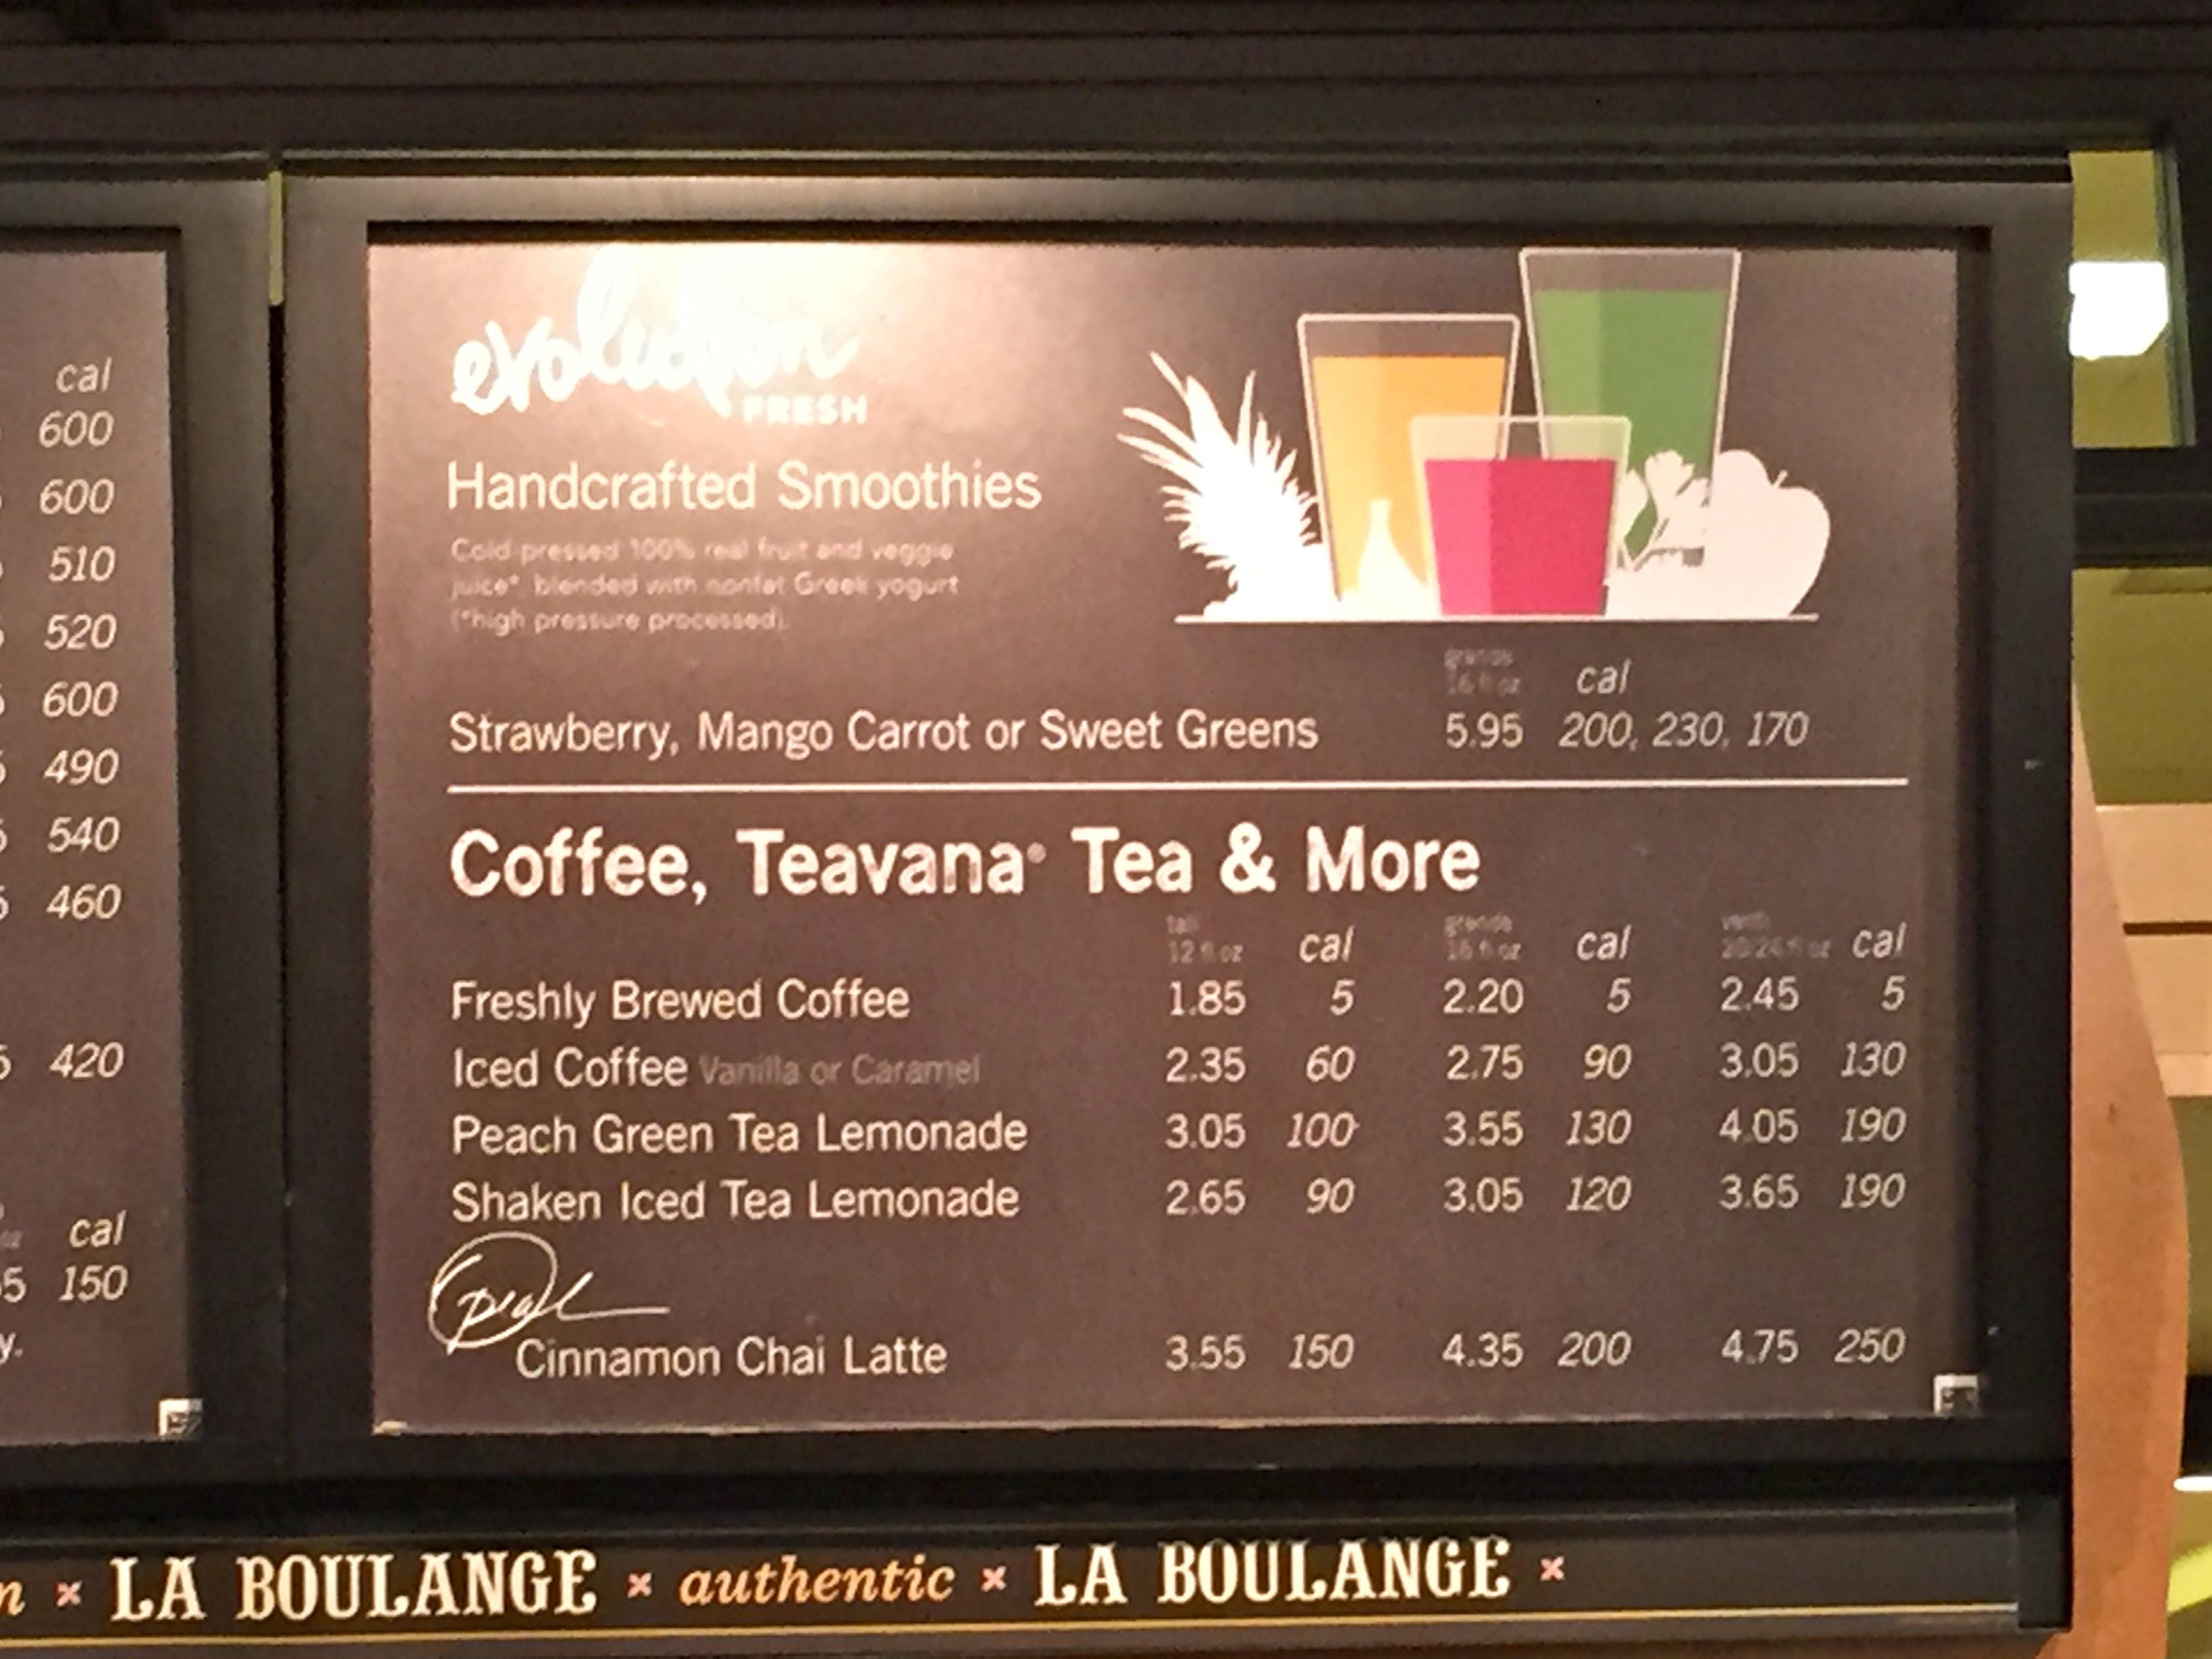
It is more expensive to buy a cup of coffee at Starbucks than it is to brew it at home.  Yet people still do it.  What does that cost difference tell us about the value of convenience?  Here’s one of Starbucks menus:

IMG_2748

There was definitely a period at the beginning where students did not know how to begin – or perhaps what they were suppose to do.  It took some time for them, and to extent me as well. to define the question.  I told them that it is natural in any problem solving situation to spend time defining the question, framing assumptions, setting up your analysis.

My teacher moves were as follows:

– Write about a time when you paid extra for convenience.  Talk it out.

– Ok so the value of convenience depends on how convenient the thing is versus the alternative.  [Future project could be to quantify convenience itself, rather than only focusing on Starbucks pricing].   That means we should standardize the convenience we are analyzing.  So let’s look at convenience through the lens of Starbucks pricing.

– What does the pricing of Starbucks coffee tell us about the value of convenience?  How could we use Starbucks to quantify its convenience.  What information would we need?

– Give various pricing data

– Ask students to come up with a value for the convenience of the k-cup vs. ground coffee, or the value of going to Starbucks versus brewing at home.

– Helping individually.   My most effective question was “For $10 you get 340g of ground coffee.  How much would it cost to get 340g of coffee in K-cups?”

It is also an interesting conversation that ground coffee and whole bean are the exact same price.  So Starbucks is saying that the convenience of having the beans ground for you adds no value to the product.

After the activity we read an article from Proffer Brainchild titled “ADDING VALUE:  A Lesson From Starbucks”

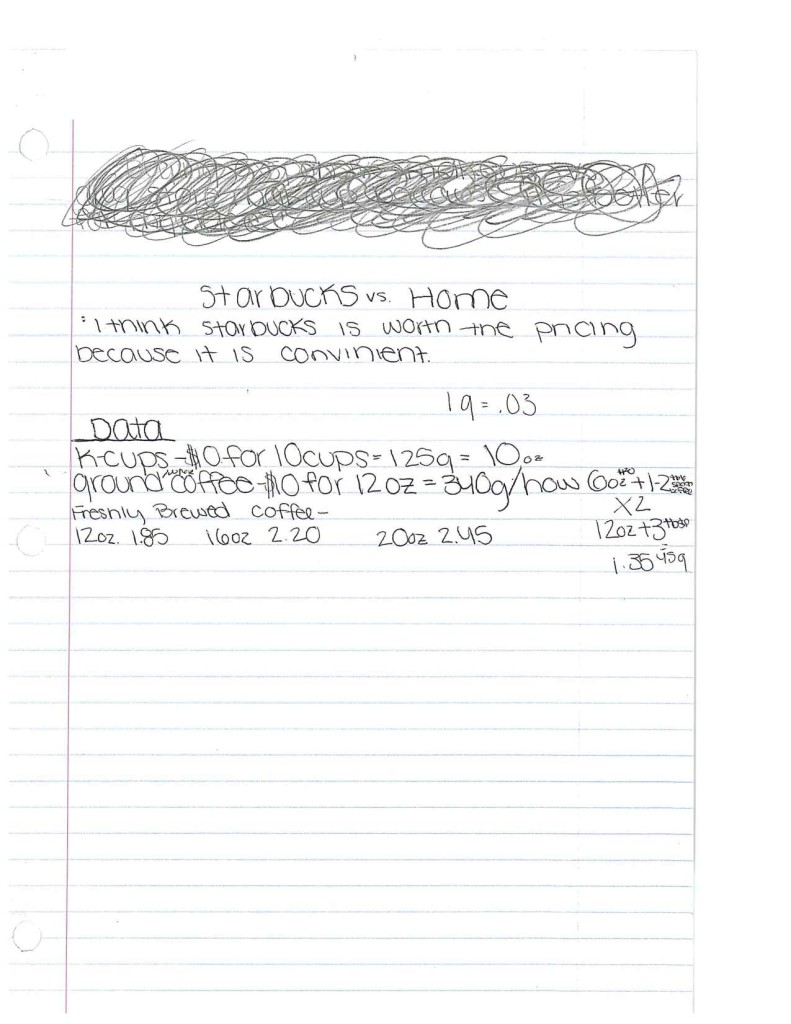
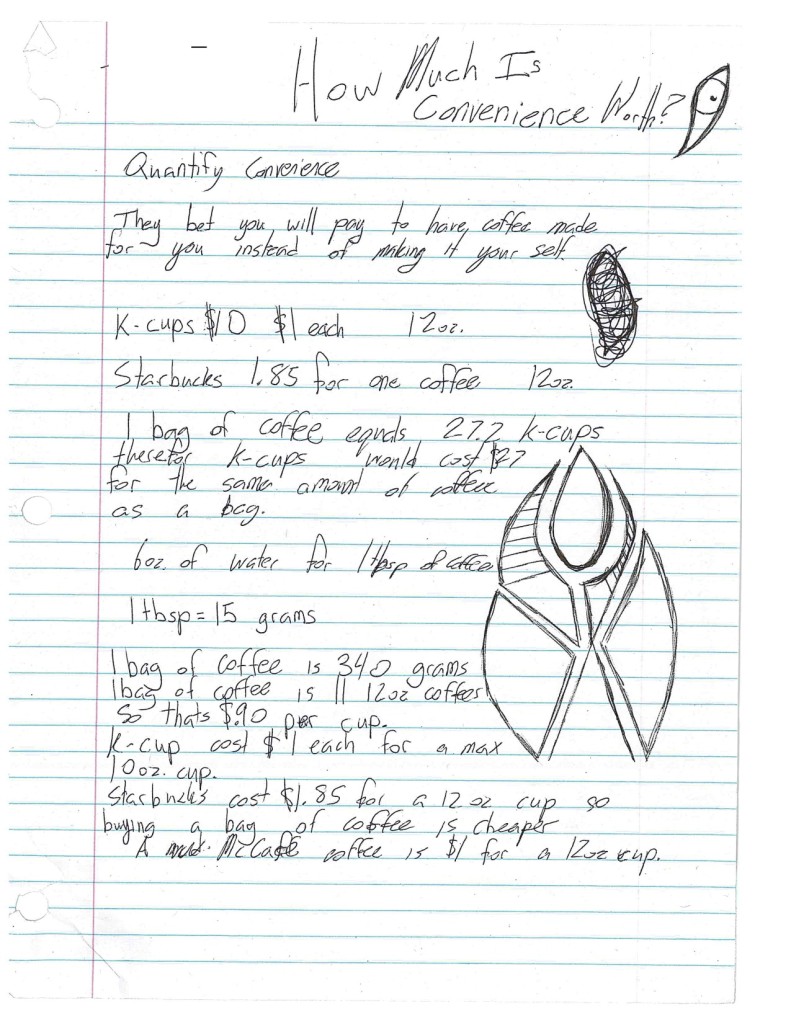
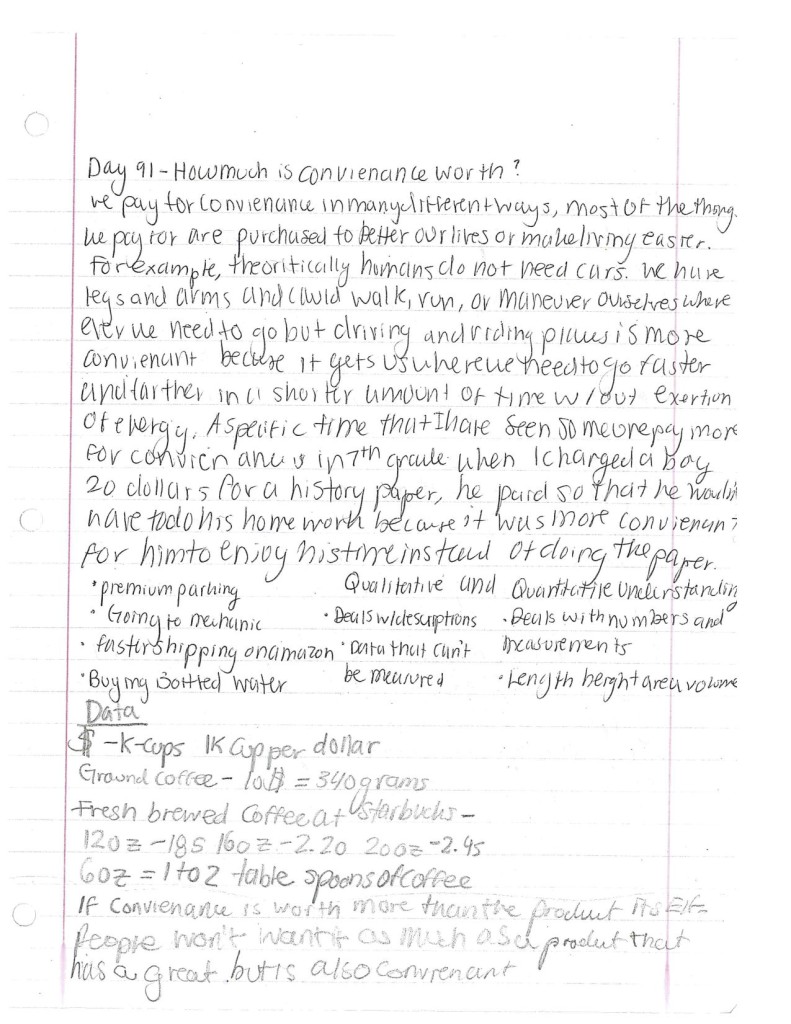
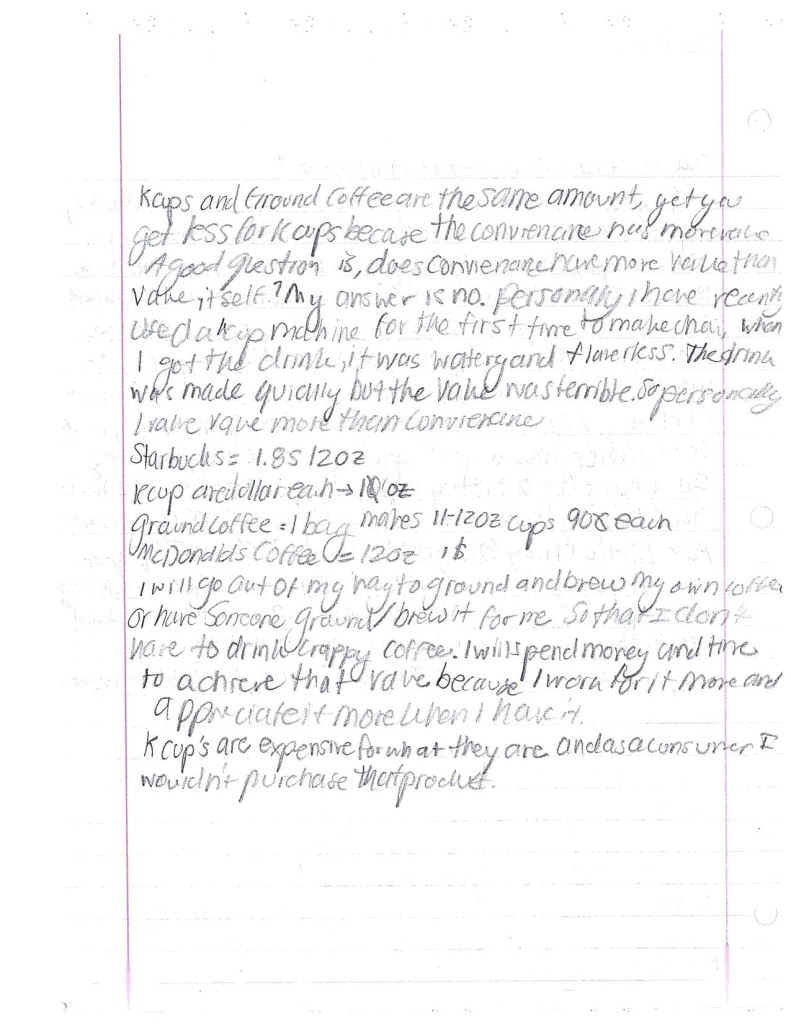
Here are some examples of student work.  The first example was the highest quality paper I received.

SW_AddingValueOliver


SW_AddingValue2


SW_AddingValue1

Lesson Learned:

It’s clear that not all students understood what I was asking – and so I concede that “What’s the value of Convenience?” was not a good driving question for this particular activity. I do see it that prompt as a great math modeling problem where students try to quantify an inherently qualitative thing. But that’s not what they were doing here.

Next year I am going to try and focus first on the k-cup vs. ground coffee prices and stick the economics concept of “adding value”. How much value is added when Starbucks puts their grounds in K-cups vs. ground coffee? And this is not just about the calculations, it’s about the argument.

 

SW_AddingValueZoe1

SW_AddingValueZoe2

Missing Assignment Buyout Program

The Overview:

This year I wanted to do Kyle Pearce’s Detention Buyout Program that Dan had highlighted in his Great Classroom Action series.  The problem was that in my new school we don’t have detentions, so I didn’t think I would get much buy-in from the students.  But there is something that all schools definitely do have:  Missing assignments!  So I created three “deals” that would allow students to pay me money in exchange for getting credit for an assignment they missed.

I used this assignment as an introduction to inequalities, but I also wanted to link the Missing Assignment Buyout Program to the linear equations we just finished covering.  That is the why as you look at this assignment, you will see a focus on connecting the information in the graphs to the information contained in the inequalities.

I sequenced this by first giving the assignment.  Then two days later I did another version of it as an opener / warmup.  And then lastly I put another version of it on their test.  Each new version offered slight modifications from the previous.

The Description:

I first offer students three possible deals for buying off their missing assignments.  I poker face the whole thing and enjoy all the “Is this legal” expressions on their faces.  I tell them to make sure they go home and talk to their parents about how much money they have budgeted for such as program.  The first question on the worksheet asks them which deal is better for them, so as an added bonus I printed out each students missing assignments and handed it to them.  This is that first worksheet:

MissingAssignmentBuyoutProgram_Page_1

MissingAssignmentBuyoutProgram_Page_2

There are a lot of interesting questions and explanations that came out of this first assignment.  For instance, having students see that x less than 5 was the same as saying x less than or equal to 4 since x could only take integer values.  Also having students see the connection between the intersection points of their graphs and the inequalities they wrote was time well spent.

A couple days later I came back to the Missing Assignment Buyout Program in the form of a opener or warmup question.  I handed the students this graph when they came into the room (two graphs per page to save paper):

MissingAssignmentBuybackProgramOpener

Then I had students write a description of each deal, as well as the inequality and equation for each deal.  This was a slight inversion of the original assignment where I gave them the description and had them write the inequality, equation, and then graph.  Now I am giving them the graph and asking them to write the description, inequality, equation.  I have them in pairs and am checking homework and taking role while they work.  Then I randomly call on pair share partners and fill in the following table that I am projecting on the board:

Screen shot 2013-11-27 at 5.18.48 PM

Lastly to make sure that they really did understand the concept, I put a similar problem to the opener exercise in their inequalities chapter test.  The test had a slight twist in a scenario where a student would want to buy the Flat Fee plan based on their number of missing assignments, but based on the money they had to spend, they would need to pick their second best option.  Here’s that problem:

MissingAssignmentBuybackProgramTest

I initially thought having them graph each deal was kind of an unnatural excercise, because why would someone ever graph something like that?  But I think it ended up working because of how the Opener and Test question both refer to the graph.  All in all student engagement was high, even with the graphing portion so I think I’ll keep it next year.

The Extension:

(good idea courtesy of my principal)

Tell the students that you have decided to only offer one deal to the whole class, and they have to decide which deal they want for the class.  This could open up a nice debate about fairness and equity – this deal is best for you since you don’t have any missing assignments, but what about these other students?  Connect this debate to something current, like Obamacare.  Discuss how math influences decisions and that often decision makers have to make decisions based on their believe on the greater good, even when the numbers indicate that some people will be negatively affected by the decision.

The Goods:

MissingAssignmentBuyoutProgram

MissingAssignmentBuybackProgramOpener

MissingAssignmentBuybackProgramTest

Stacking Cups Assessment

When three of your favorite bloggers all write about the same lesson (Dan, Andrew, Fawn) it is a pretty safe bet that you should do the lesson.  I used Andrew’s 3Act video because my students can be pretty green and I might not hear the end of it if I couldn’t find an additional use for all these cups I was bringing into the class.

I don’t have anything to add to what was already said by Dan, Andrew, and Fawn, so I will just share a problem I created that you can put on your midterm that is a slight twist to the presentation of the original problem:

StackingCupsTestQuestion

1.  How many cups would stack in a 250 cm door?

2.  What are the dimensions of the cup?  Draw it and label it with the dimensions.

I suppose you could ask for the y-intercept and slope and all that stuff too if you wanted.

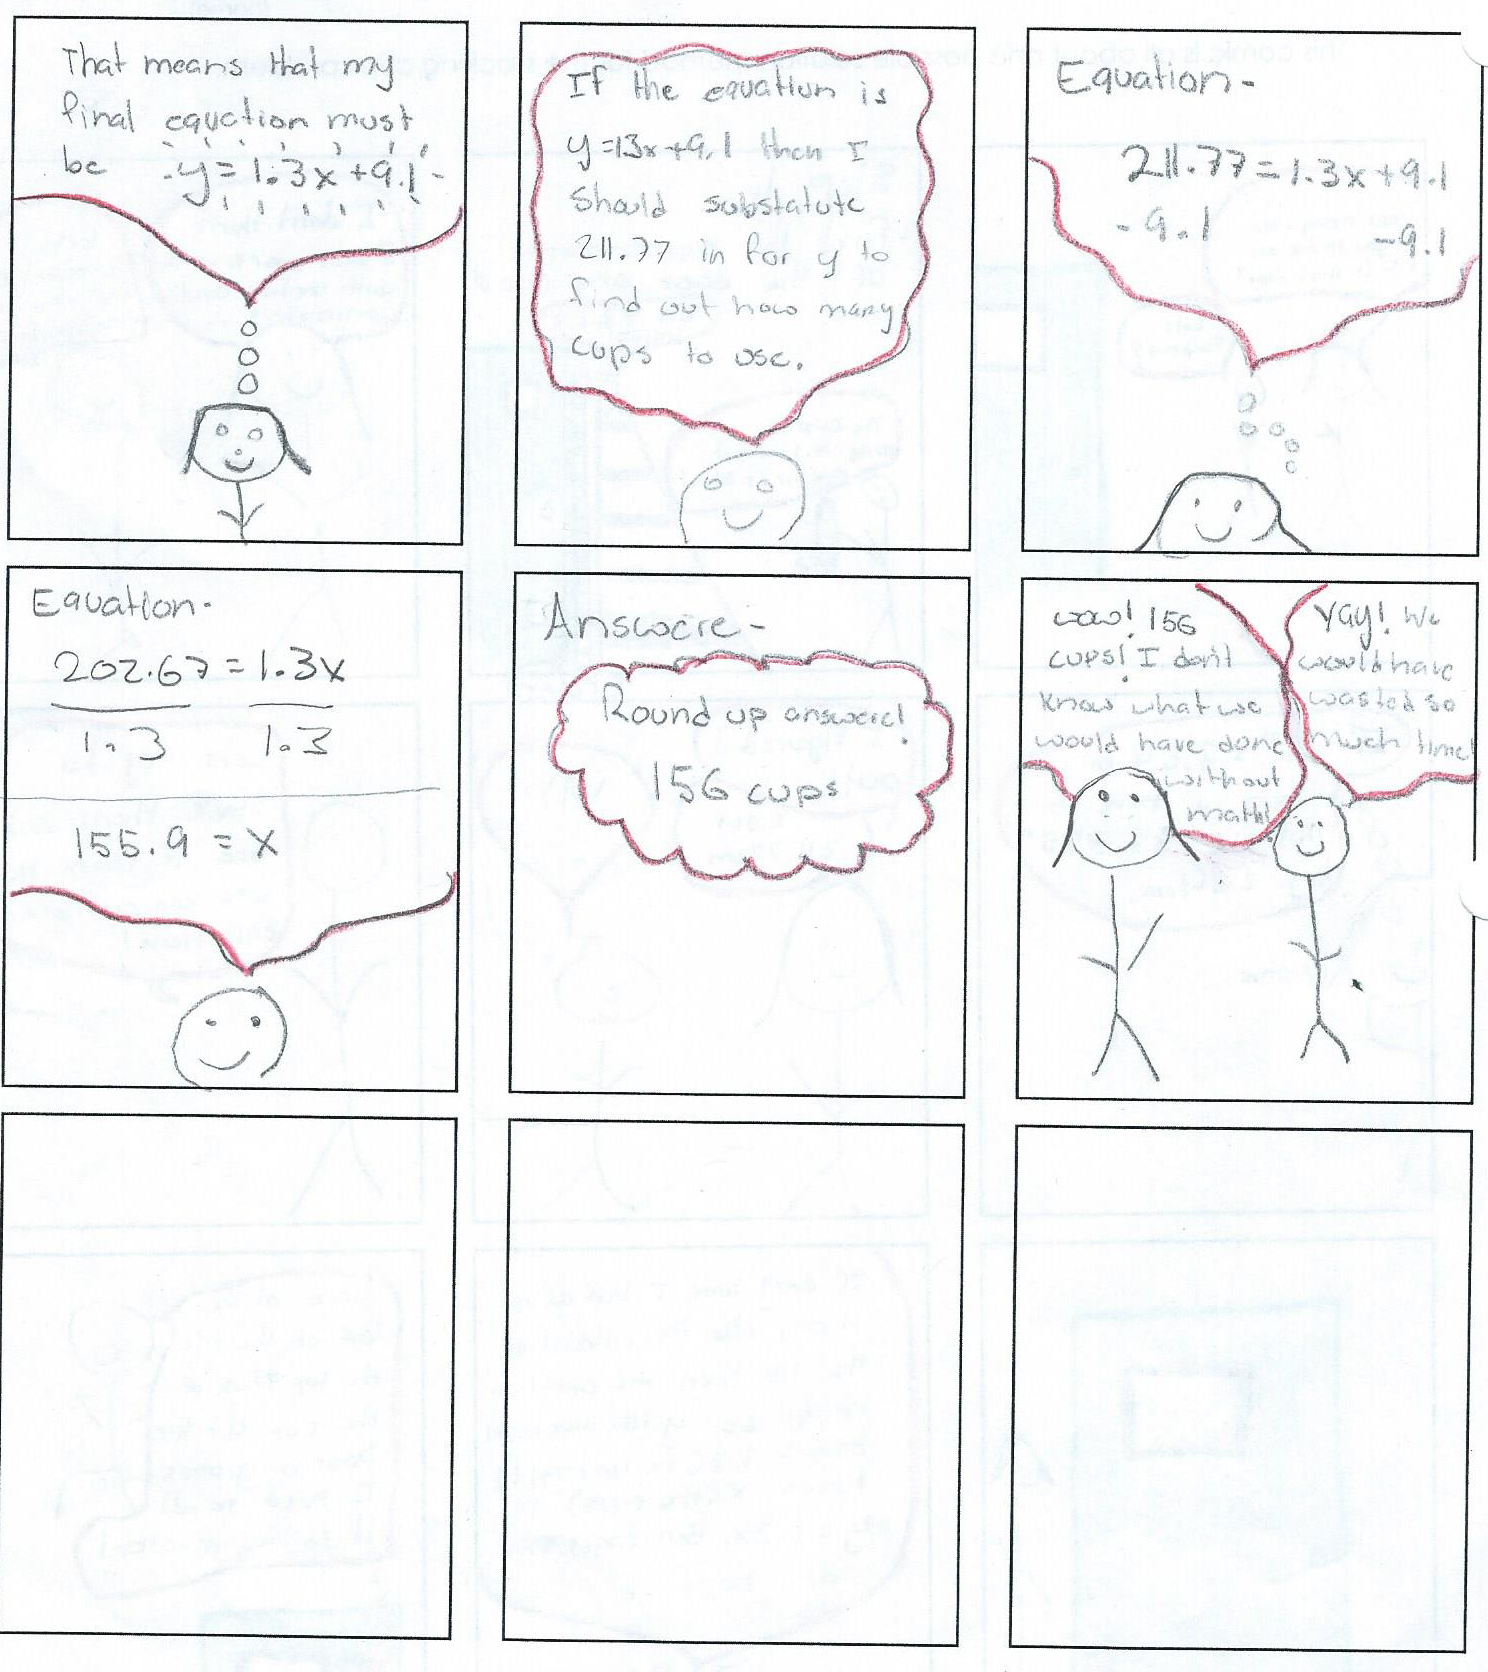
Moving on from test questions – The actual lesson went great for me and I am definitely looking forward to doing it again next year.  When I did this problem in algebra I had the students make a Stacking Cups comic that was supposed to describe how to solve the stacking cups problem.

SCcomic1

SCcomic2

I like the comic concept because I think this is a very visual problem, and since I didn’t provide them with actual cups they needed to create their own visuals.  I have been trying to get students to give me a visual for every word problem they do this year.  My stated reasoning for that has been that visuals help you give a clearer and more convincing justification for your solution.

In order for students to learn how to construct a viable argument and critique the reasoning of others (Let’s hear it for MP.3!!!), we are going to have to have an iterative process on a couple problems where they essentially hand in drafts, and we keep having them make improvements.  I think this is a great problem to do for that since it has a couple nice extensions for system of equations (different sized cups) and geometry (here).

Concert Tickets Remix

Word Problem remix here.

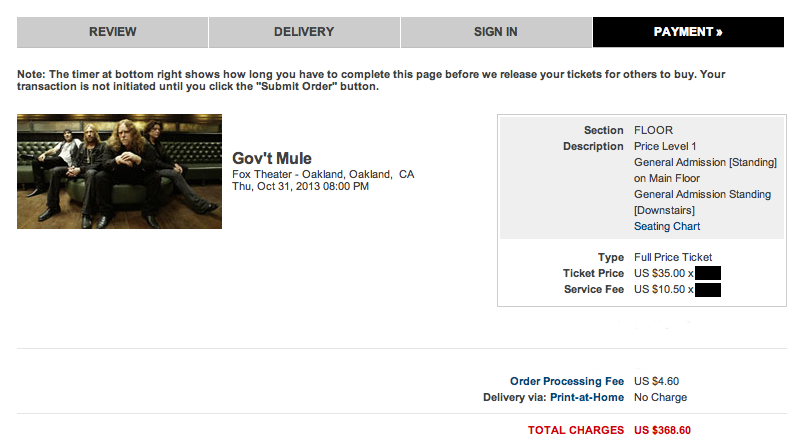
I started by playing some Soulshine from Gov’t Mule to set the mood if you will.  From there I pretty much just showed the image below which is a screenshot from the Ticketmaster site when I went to buy the tickets.

This is not the exact image from Ticketmaster because I photoshopped out where they give the subtotal for the cost of the tickets and also where they again give the Tickets/items price because I wanted the students to have to take into consideration the order processing fee.

GovMuleTixOriginalEDIT

At this point I just let the black rectangle do it’s thing.  Student engagement was high.  I required each student to also draw a diagram of this situation that would be useful in explaining their thought process.

Then the reveal.

GovMuleTixOriginal

And lastly I give them the original textbook problem that inspired the remix:

A ticket agency sells tickets to a professional basketball game.  The agency charges $32.50 for each ticket, a convenience charge of $3.30 for each ticket, and a processing fee of $5.90 for the entire order.  The total charge for an order is $220.70.  How many tickets were purchased?

I had very high engagement in all three algebra classes even with the textbook problem.  The students felt confident with it and they wanted to figure it out.  Success!

As a side note, lead singer / guitar player Warren Haynes is one of my idols, so giving him some props in a lesson was fantastic.  A few year ago he headlined the High Sierra Music Festival and it was the greatest set I’ve ever experienced.  It’s here.  I recommend beginning with his rendition of “I’d Rather Go Blind” with Ruthie Foster (track 10)


My Day 1 Lessons For 2013

This year I am teaching algebra and geometry again – new school, same subjects.    I have decided to do no introduction or ice breaker activities.  No syllabus on day 1 (which I never have done) either.

Last year I did the straw bridge challenge and I loved it and definitely recommend it.  But I am scrapping it this year due to the time constraints of  focusing on CCSS in a district that is still giving the STAR test.  So I choose these two activities for their more direct relationship to standards I must teach, as well as their low entry point and interesting hooks.

Algebra

Day 1 in algebra is going to be my Getting to Vegas problem, which is simply a personalization of a problem Dan Meyer describes here.  When I was living in Forestville some friends and I decided to go to Vegas.  There are two airports that we could have used – the smaller local airport in Santa Rosa, or the larger airport in San Francisco.  Which airport should I have took, or will I take next time?  I have screen grabs of all relevant information in the slides.

A couple extensions:  How long would the Vegas trip need to be in order for the Santa Rosa airport to be cheaper?  (Eventually the more expensive parking at SFO takes over).  Or Dan’s scenario of taking a shuttle from Santa Rosa to the San Francisco airport vs. driving directly to San Francisco.

Presentations.004

The Goods:

 GettingToVegas

Geometry:

In geometry I’m starting with Dan’s Taco Cart problem.  I am just going to go to keep it as Dan vs. Ben, because I am a bit intimated on day1 to follow Fawn’s more interactive implementation allowing students to choose their own paths.

This is an exercise with the Pythagorean Theorem, which is great for day 1 because they have all seen it before.

The Goods: 

TacoCartWS

TacoCartWS

Running Off The Burger

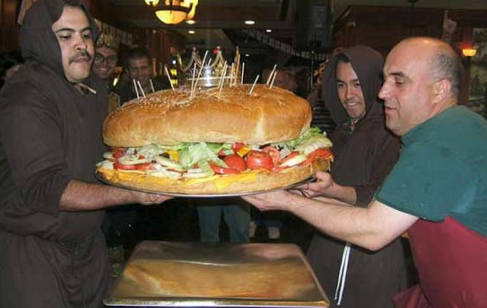
How far would you have to run to burn off all the calories from this burger?

TitanicBurger

The Overview:

This is a slight remix of a traditional calorie problem in a math text.  Bascially I first show the students 4 burgers with the calorie count blacked out, and have them guess what it is for each burger.  Then I ask them to figure out how many miles they would have to run in order to burn off the calories from each burger.

The number of calories burned depends on how many miles you run and your weight:

# calories burned = 0.75(your weight)(miles ran)

Runners use the general rule of thumb that you burn 100 calories per mile.  You might what to use that fact for something – maybe ask them for what weight is that actually true.

The Advice

– The problem asks students to use their weight.  I offer up my weight and ask if some students could help me by doing the calculations for me.  That way they can choose to do it for themselves or me.

– I do not initially give them the relation for calories burnt vs. miles.  I make them request that information based on their need to solve the problem.

– If you want to incorporate a comparison between running and walking, here is the relationship for walking:

calories burned = 0.53 (your weight)(miles ran)

– I got these functions from Runner’s World:

The Goods:

RunningOffTheBurgerHandout

RunningOffTheBurgerPresentation

The Extension:

How many times around the track would you have to run to burn off this burger?

BigBurger

This burger is called “The 8th Wonder”.  Although the calories of it have not been calculated, we know it’s 105lbs.  I have the students use the fact that “The Beast” is 15lbs and 18,000 calories.  Discuss with them if a linear model is sufficient for this calculation.

Investigator Training

The Description:

The goal here was to use Dan Meyer’s “Bone Collector” 3Act problem, as the motivation for a series of lessons on scaling.

dollar2foot

The basic premise is as follows:  I show the Bone Collector clip first (see the link above for the clip), tell them we need to figure out the shoe size of the killer because we need to make sure that the killer is not in the room.   Then I concede that I realize they are not trained investigators.  Thus I tell them that over the next couple days we will be doing some investigator training, to get them ready to take on this case.   I help a lot during the first two cases, but I provide little help during the Bone Collector case – and the good news is that they didn’t need much help on it after the investigator training.

CASE 1 “The Drug House”

For their first case, I used a google maps images (see Keynote or PowerPoint file below) of a huge house that I was calling a “known drug” house (It’s actually Michael Jordan’s house).  The goal is for them to calculate the area of the very suspicious large building at the bottom right of the picture, where a lot of cars are located.  I tell them the FBI wants to perform a raid but they do not know how many agents to send, because they don’t know the size of the building.  And they are waiting for our calculations to proceed.

DrugHouseGoogleMaps

I handout the above picture to each student.  Then do a little strategy session where they write down how they are going to calculate the size of the building.  At that point they are given time to solve it with their pair/share partner.

The next day  I come and say that althought the FBI was happy that we correctly calculated the size of the building, unfortunately after performing the raid they learned that this was not a drug house, it was in fact Michael Jordan’s house.  And that big building is a basketball court.

CASE 2 “The Statue Thief”

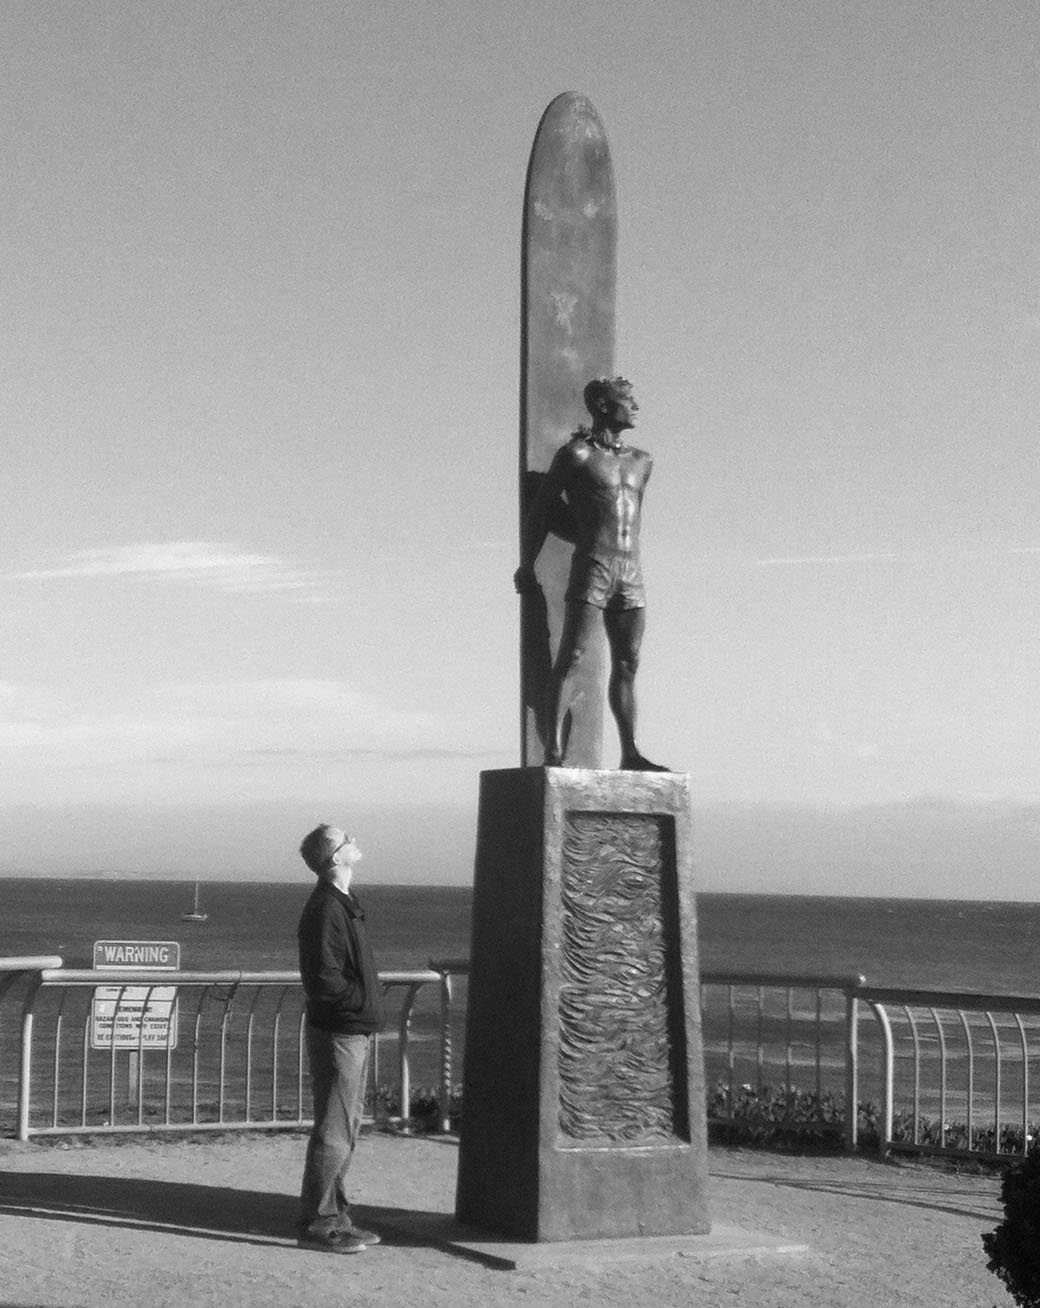
I use a picture of the Surfer Memorial Statue in Santa Cruz.  Then I show a the same picture but with the statue photoshopped out.  I then tell them that a security camera picked up a very suspecious person who had visited the statue multiple times before night of the theft , and that the FBI needs us to find the height of the suspect in the picture.  This case is very similar to the Bone Collector.

StatueThief3_2

(awesome statue)

StatueThief3

(sadly it was stolen)

StatueThiefSuspect1

(but we have a suspect)

Students get a copy of the image above.  We again do a strategy session, where I require them to write a strategy for finding the suspects height.

The next day I reveal that the suspect was captured and he is 6ft.  Most students calculate something around 6″3′, so we spend some time talking about possible sources of error.

CASE #3 The Bootprint

Here we do the actual Bone Collector problem, delievered in much the same way that is described in Dan’s blog.

The Advice:

– I have students work in groups of two.

– I don’t spend the entire class period on these.  I do investigator training for the first 20 minutes or so, and then move on to something else.  Thus I essentially make this investigator training week.

– I help the students with the strategy sessions for the two practice cases, and then leave it up to them for the Bone Collector problem.

– Definitely play up the investigation aspect of these cases.  I tell them how much investigator make and that they should take these cases to the polic department and interview for a job.  If a couple students complain the quality of the bootprint picture is not very good, respond with “Yeah, I’m not sure why the FBI would provide such a low quality image”.

– That is me in the picture for the “Statue Thief” problem.  That is definitely an added bonus if you can do it.  It allows me to completley deny it’s me, while also saying “Look it’s not enough to just tell the police the suspect is extremely good looking, we have to get them information about his height”.

The Results:

High level of engagement.  Take a listen to student reaction when they hear that the shoe print is a size 10.

Bone Collecter student reaction

The students were upset (yes, actually upset) because all their solutions were between size 13.5 and size 16.5 .  They all calculated a larger size because they used the bootprint, rather than the actual size of the foot inside the boot to convert to shoe size.   I ended the lesson with a great back and forth with the students about what happened with their calculations.

One of my lowest performing students asked me if her proportion she setup was correct…  it was.

Using the Bone Collector clip without the associated investigator training works too, but not as well for me.  I really enjoyed these lessons, and I felt like my two initial cases put the students in a place to be successful with the Bone Collector problem.

The Goods:

Dan Meyer – Bone Collector problem

The Drug House Handout

The Statue Thief Handout

Bone Collector Bootprint  (just pick one – my girlfriend and I messed around with the image in photoshop to get the best quality for different printers)

InvestigatorTraining   (Keynote and PowerPoint)  I created this in Keynote, and highly recommend using Keynote.

Update 1:

To see whether or not the students retained any of this, I put the following picture into the chapter test.  The question was:  How tall is the tree?

MrHaysAndTree

The guy in the picture was brave enough to take me on as his student teacher and I am a profoundly better teacher because of it.  His name is Walt Hays.  His height is 6ft.

Update 2: 3/23

Based on Debbie’s comment, I have fixed the typos in the Keynote and Powerpoint files and adjusted the scaling to result in an answer that is consistent with the size of the tennis court next to the basketball court building.


Dig a Hole to China

The Description:

Show them this website and ask them if they can figure out what it is all about:

This site shows the exact opposite side of the earth from anywhere on earth.  So if you dug a hole straight down through the center of the earth, this site shows you were you would end up.  Every student in my class had heard the old saying about “dig a hole to China”, where it is believed that if you dug a hole straight through the earth, you would end up in China.  Apparently it’s not true, you would end up in the middle of the Atlantic.  Students will definitely ask you to find where you would need to start digging if you wanted to end up in China (Argentina).

That is about all you need to pose the question “If you were to dig a hole to China, how deep would the hole be?”

I give the students the circumference of the earth.   This lesson is teaching them to find the radius from the circumference.

C = 2(pi)r

The Advice:

At the end of class come back to the fact that if you give them radius, they would be able to give you diameter and circumference.  If you give them circumference, they should be able to give you radius and diameter.

The Goods:

I do not give any handouts.

Macro-Differentiation

These are a listing of hastags that I use to catagorize my lessons plans.  Each catagory represents a different style lesson plan.  My instructional goal is typically to make sure that I use each hashtag at least once a month.  The goal of this blog is to share all the lesson plans that I use under each hashtag.

My detailed lesson plans are my Keynote slides.  But along with those, I make a quick, calendar-style overview to me a general idea of what I am doing.  It’s on this calender where I place the hashtags at the bottom of each day.  This allows me  to quickly look back at what I have been doing, and know whether of not I am differentiating.  For example, here is two weeks worth of my lesson plans in geometry.  Notice that I can quickly see whether or not I have differentiated my instruction, without having to analyze each specific lesson plan.  The hashtags allow me to get a quick sense of what I have been doing, and what I have not been doing.


*Notes –

-The term “perplexity” is being used as described by Dan Meyer here