Tag Archives: algebra

Well Flow Rate – “Real World” Math

Keeping with the easy definition of “real world” being “math someone needed to do at their job” – I actually prefer the term “industry math”, but regardless here’s the question that needed to be answered:

My wife’s working on a project where they are building a house on a property without a well or access to city water.  So they dug a 425ft well that was 8 inch in diameter.  When they finished the dig at 3:00 pm it was completely dry.  The next day, at 7:00 am, the well had filled with water up to 45ft below the surface.

How fast is the well filling up in gallons per minute?

They wanted 1.25 gallons per minute.  Do they need to dig another well?  Wells are about $50 a foot – so yeah, they would rather not dig another one.

well1
(digging the well)

well2
(well finished! That’s the cap they left on it)

They used a falling rock to determine how much of the well had filled with water.  Well (not the noun), they also used a cell phone connected to a string but isn’t that just too obvious?

Here’s the video of the rock drop:

Well Rock Drop


Cheers!

Adding Value – A Starbucks Lesson

This lesson could be better – but it was my first shot at it. I still definitely recommend it because of the great math conversations we had around convenience and adding value. Here’s the driving question I used:

What is Convenience Worth?

But it didn’t work as well as I wanted it to because we were really only looking at the convenience of the k-cup vs. ground coffee vs. going to a coffee shop.  It’s a cool driving question, but not necessarily the focus of this lesson.  This lesson is based more on “adding value” – where value is defined as what people are willing to pay for.  Starbucks added value to it’s coffee grounds by putting them into K-cups, and that is why they are able to charge more for it.  So how much value did they add?

So here’s the lesson:

Angle 1:  K-cups vs. Ground Coffee

Starbucks makes K-cups and ground coffee, and both sell for $10!  [excellent] So are they the same price?  The K-cups are a package of 10, 12.5 gram cups.  And the ground coffee is in a 340g bag.  Starbucks is able to elevate it’s price for K-cups because they are more convenient than traditional brewing methods.  So what’s the value of that convenience?

IMG_2741

IMG_2742

IMG_2732


IMG_2733

Angle 2:  Coffee Shop vs. Brewing At Home

It is more expensive to buy a cup of coffee at Starbucks than it is to brew it at home.  Yet people still do it.  What does that cost difference tell us about the value of convenience?  Here’s one of Starbucks menus:

IMG_2748

There was definitely a period at the beginning where students did not know how to begin – or perhaps what they were suppose to do.  It took some time for them, and to extent me as well. to define the question.  I told them that it is natural in any problem solving situation to spend time defining the question, framing assumptions, setting up your analysis.

My teacher moves were as follows:

– Write about a time when you paid extra for convenience.  Talk it out.

– Ok so the value of convenience depends on how convenient the thing is versus the alternative.  [Future project could be to quantify convenience itself, rather than only focusing on Starbucks pricing].   That means we should standardize the convenience we are analyzing.  So let’s look at convenience through the lens of Starbucks pricing.

– What does the pricing of Starbucks coffee tell us about the value of convenience?  How could we use Starbucks to quantify its convenience.  What information would we need?

– Give various pricing data

– Ask students to come up with a value for the convenience of the k-cup vs. ground coffee, or the value of going to Starbucks versus brewing at home.

– Helping individually.   My most effective question was “For $10 you get 340g of ground coffee.  How much would it cost to get 340g of coffee in K-cups?”

It is also an interesting conversation that ground coffee and whole bean are the exact same price.  So Starbucks is saying that the convenience of having the beans ground for you adds no value to the product.

After the activity we read an article from Proffer Brainchild titled “ADDING VALUE:  A Lesson From Starbucks”

Here are some examples of student work.  The first example was the highest quality paper I received.

SW_AddingValueOliver


SW_AddingValue2


SW_AddingValue1

Lesson Learned:

It’s clear that not all students understood what I was asking – and so I concede that “What’s the value of Convenience?” was not a good driving question for this particular activity. I do see it that prompt as a great math modeling problem where students try to quantify an inherently qualitative thing. But that’s not what they were doing here.

Next year I am going to try and focus first on the k-cup vs. ground coffee prices and stick the economics concept of “adding value”. How much value is added when Starbucks puts their grounds in K-cups vs. ground coffee? And this is not just about the calculations, it’s about the argument.


SW_AddingValueZoe1

SW_AddingValueZoe2

Monomial Partners

“What’s your name, what’s your monomial?”

This is a great activity that was inspired by Matt Vaudrey’s Equation Speed Dating.  In this lesson each student gets to create their own monomial – which I constrained to having to be even and with a variable.  Then they break up their paper into three columns:  Partner / Our Binomial / Our Rectangle.  The students pick a partner and join each others monomials together to create “Our Binomial”.  Then they factor their binomial and represent it as a rectangle by labeling it’s dimensions and indicating the area.  I circulate the room and once it appears every group is finished, I have everyone get up and find a new partner.  I’m demanding here that all students get up out of their seats and move somewhere new.

IMG_1868

After a couple rounds I started having them draw their monomial and their partners monomial as separate rectangles, and then draw them together.

I have been focusing on a geometric approach to factoring, so the rectangle column was a great addition to previous times when I have done this activity but only asked for the solution.

The column “Our Binomial” does a nice job reinforcing that a binomial is the combination of two monomials.

The Advice

Don’t require them to say “what’s your monomial?”, “do you agree that our binomials is….  “, but inspire them to say it by modeling it.  A lot of my students were saying it because I was giving them messages that anytime they get the chance to say “monomial” or “binomial” they need to take it.

Tell the students not to move onto a new partner when they are finished.  They need to wait until you tell them to switch partners.

Remind them that you are really counting on the partners to catch any errors! Because you can’t do the problems on the board since every pair is working a different problem.  “And yes, you are the partner I am counting on for someone else.”

“What’s your name, what’s your monomial?”   No that’s not a pickup line for Speed Dating…  or is it?

Explaining “Explain”

Here is a released question from Smarter Balanced (I even answered it!!!):

ExplainingExplain2

Ok I lied.   That was an edited version of a Smarter Balanced question – here’s the original:

ExplainingExplain1Now all of a sudden my answer doesn’t seem sufficient anymore 🙁   Here’s my best guess at a popular student answer:

ExplainingExplain3

This word “explain” is keeping me up at night lately.  In this problem I’m not sure adding the word explain to the end gains us enough to warrant it.  To achieve Common Core we can’t just throw the word “explain” after every problem we did last year and call it a day.  By the way I’m not saying that’s what the Smarter Balanced Consortium did on this particular problem.  But this use of the word “explain” does bring two things to mind:

1.  It’s hard to explain your mathematical reasoning without access to drawing diagrams.

2.  If we ask students to explain something – it should be something worth explaining.

With respect to #1 – my focus this year has been on explanations through multiple representations.  Basically I have students make connections between diagrams, tables, graphs, mathematical symbols, and written descriptions.  I feel underwhelmed asking students to explain with just a typed explanation.  I want explanations to look like this:

SGBridge

In the student work above – image if it was only the conclusion.  Look at how much would be lost.

There are certainly better answers to the rectangle problem from Smarter Balanced than I offered up here.  I actually really like the problem itself, I just do not think having them explain it gains us much versus just solving it.

It’s hard to explain the word explain.  It’s a word that only makes sense to me until I try to explain it.

T-Block Visual Pattern

I created this visual pattern as a followup to the I Rule! exercise from MVP.  It is intended to be more difficult than I Rule!.  When I gave this to my students, I included a linear T-Block just like MVP does for I Rule!  

TBlock

I asked them two questions:

1.  How many squares are in the 10th sequence

2.  How many squares are in the nth sequence

Only a couple of my students actually got to the right answer, but the effort was tremendous.  I had students coming to me during lunch and saying they had asked all their friends and they couldn’t figure it out.  Students were telling me they worked with their parents and couldn’t get it.  I had a student (who failed first semester mind you) tell me that her and her two math tutors stayed 45 minutes after their session working on it and couldn’t figure it out.  She had two pages of work.  I have a couple students who get 100% on everything they touch, and they didn’t figure it out.  So yay me!  I challenged them 🙂

Here’s the I Rule! pattern:

IBlockMVP

Check out many more visual patterns at visualpatterns.org – a site created and curated by my conference buddy Fawn Nguyen (@fawnpnguyen)

The Goods:

Here is the worksheet I used, not sure if I will include the linear T next year.

TBlockWithLinear

The Handshake Problem

The Overview:

I had a lot of fun with the Handshake Problem this year, so I figured I would write about it.  My goal was to use less structure (meaning no worksheet – especially one with pre-staged t-tables).

I revealed the question in three parts, each time raising the number of people shaking hands:

– 5 people go to a party and shake every one’s hand once.  How many handshakes are there?

– If everyone in the class shakes everyone else’s hand, how many handshakes would that be?

– If everyone in the school shakes everyone else’s hand, how many handshakes would that be?

Lastly, in a rather last second “I want them to process this more” moment,  I had them create solution guides for it.

The Description:

I began with the following two questions as warmup problems:

1.  5 people go to a party and shake every one’s hand once.  How many handshakes are there?

2.  If a 6th person shows up to the party, how many handshakes will they give?

After the warmup I raised the bar a little bit by increasing the amount of people who shake hands:

“If everyone in the class shakes everyone else’s hand, how many hand shakes would that be?”

The class problem raises the bar a little, but still leaves the door open for the students to add up each individual scenario.  For example, they noticed that the 31st student would shake 30 hands, and the the 30th student in the room would shake 29 hands and so forth.  So the final answer would be 30 + 29 + … + 2 + 1.  No equation needed, no additional math tools needed.  But I still took this moment to show them a new math tool that would have made there job easier – the summation!  I pulled up the Wolfram Alpha Summation calculator and let them know that a math symbol will do all that addition for you.

WolframAlphaSummation

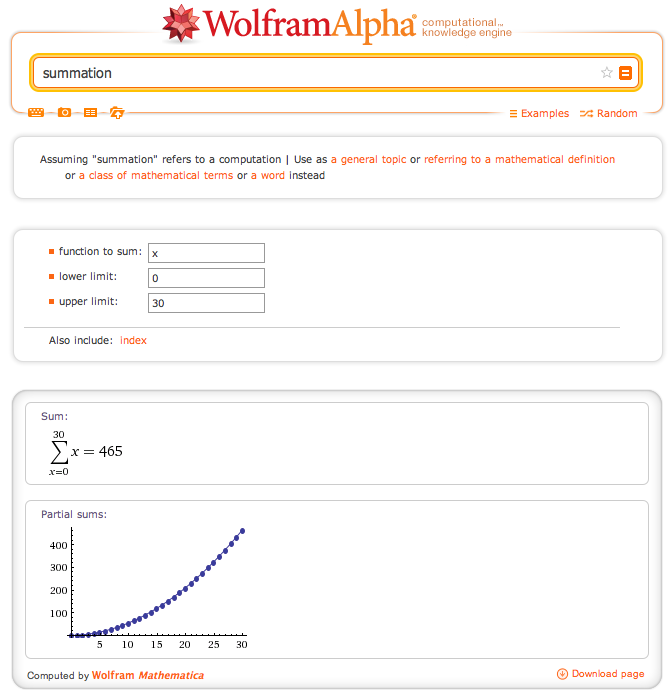
Then I asked them – How many handshakes would there be if everyone in the school shook eachothers hand?  Now they are dealing with a numbers that is far too big for them to simply do the summation on their own.  But luckily they had this new math tool I just gave them.  I kept that summation calculator up on my computer for them to use.  Pattern found – now execute.  And some of them literally ran to my computer to find the new sum.  Now I can ask them whatever the hell I want – If everyone on earth shook each others hand?  The size of the number is irrelevant now!  They got this.

Finding the above pattern was the most popular solution method.  But other students created a t-table and looked for a pattern to model with an equation.  They pretty quickly noticed that the equation that describes this situation had to be quadratic because we’ve looked at quadratic patterns before.  From there they made things fit and discovered the equation:  (x^2-x)/2.  I told the students that they just had to make the numbers fit.  Which was fine for the students who are good at creating equations like that.  They know what they want the function to equal, they know it’s quadratic – go to work.  The rest of the class was not amused.  And that’s when a student walked up to the whiteboard and amazed all of us.

Jose came up to the board and said, “we know that it is quadratic from the t-table.  So let’s assume there are 3 people at the party.  3 squared would be 9 handshakes, which accounts each person shaking the other two peoples hands, and their own hand.”

photo 1

“But they can’t shake their own hands, so we have to get rid of those three handshakes”

photo 2

“Here we are still double counting each handshake.  So then we must divide by 2 in order to only count each handshake once.”

photo 3

Oh my God Oh my God Oh my God!!!  That was soo excellent!  I had never thought about the problem like that!

And with this equation in hand, when I raised the bar to how many handshakes there would be if every student in the school shook hands, they saw how quickly they could answer it by plugging in the school’s population.

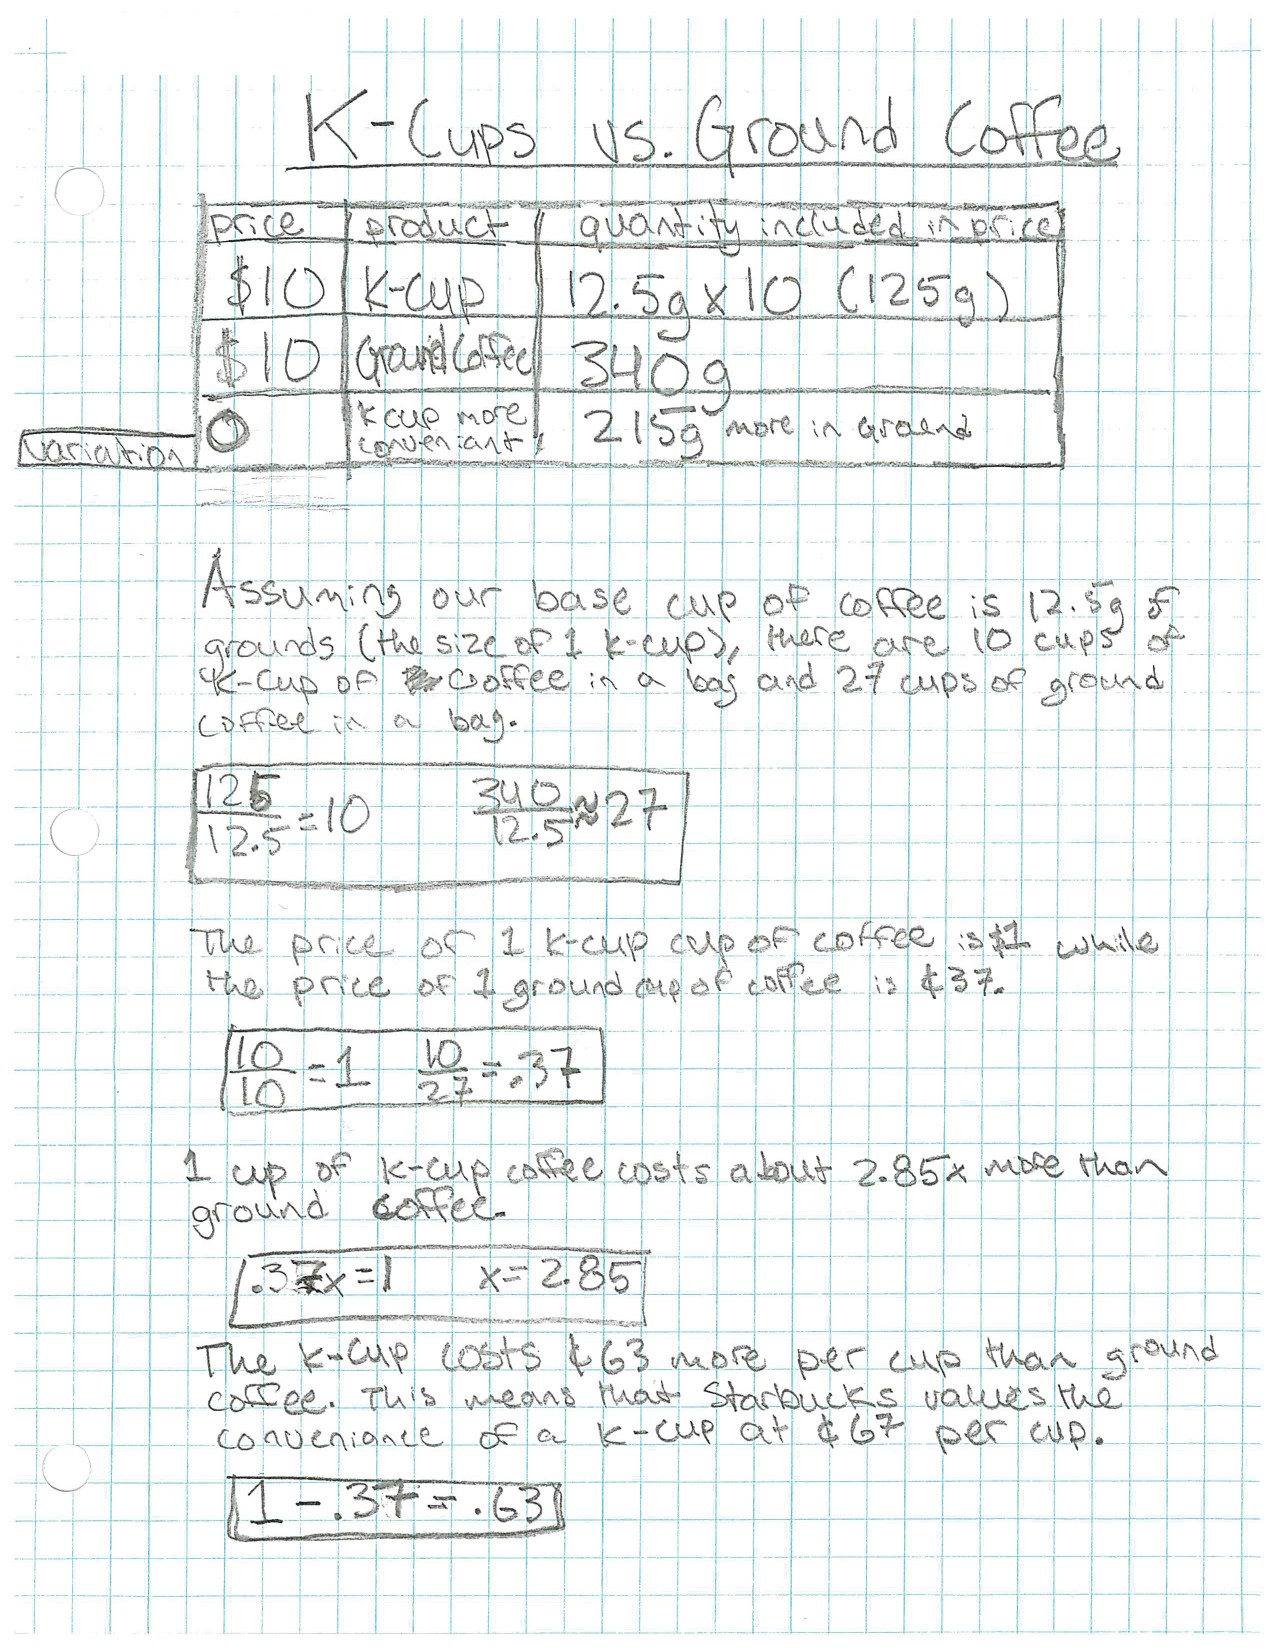
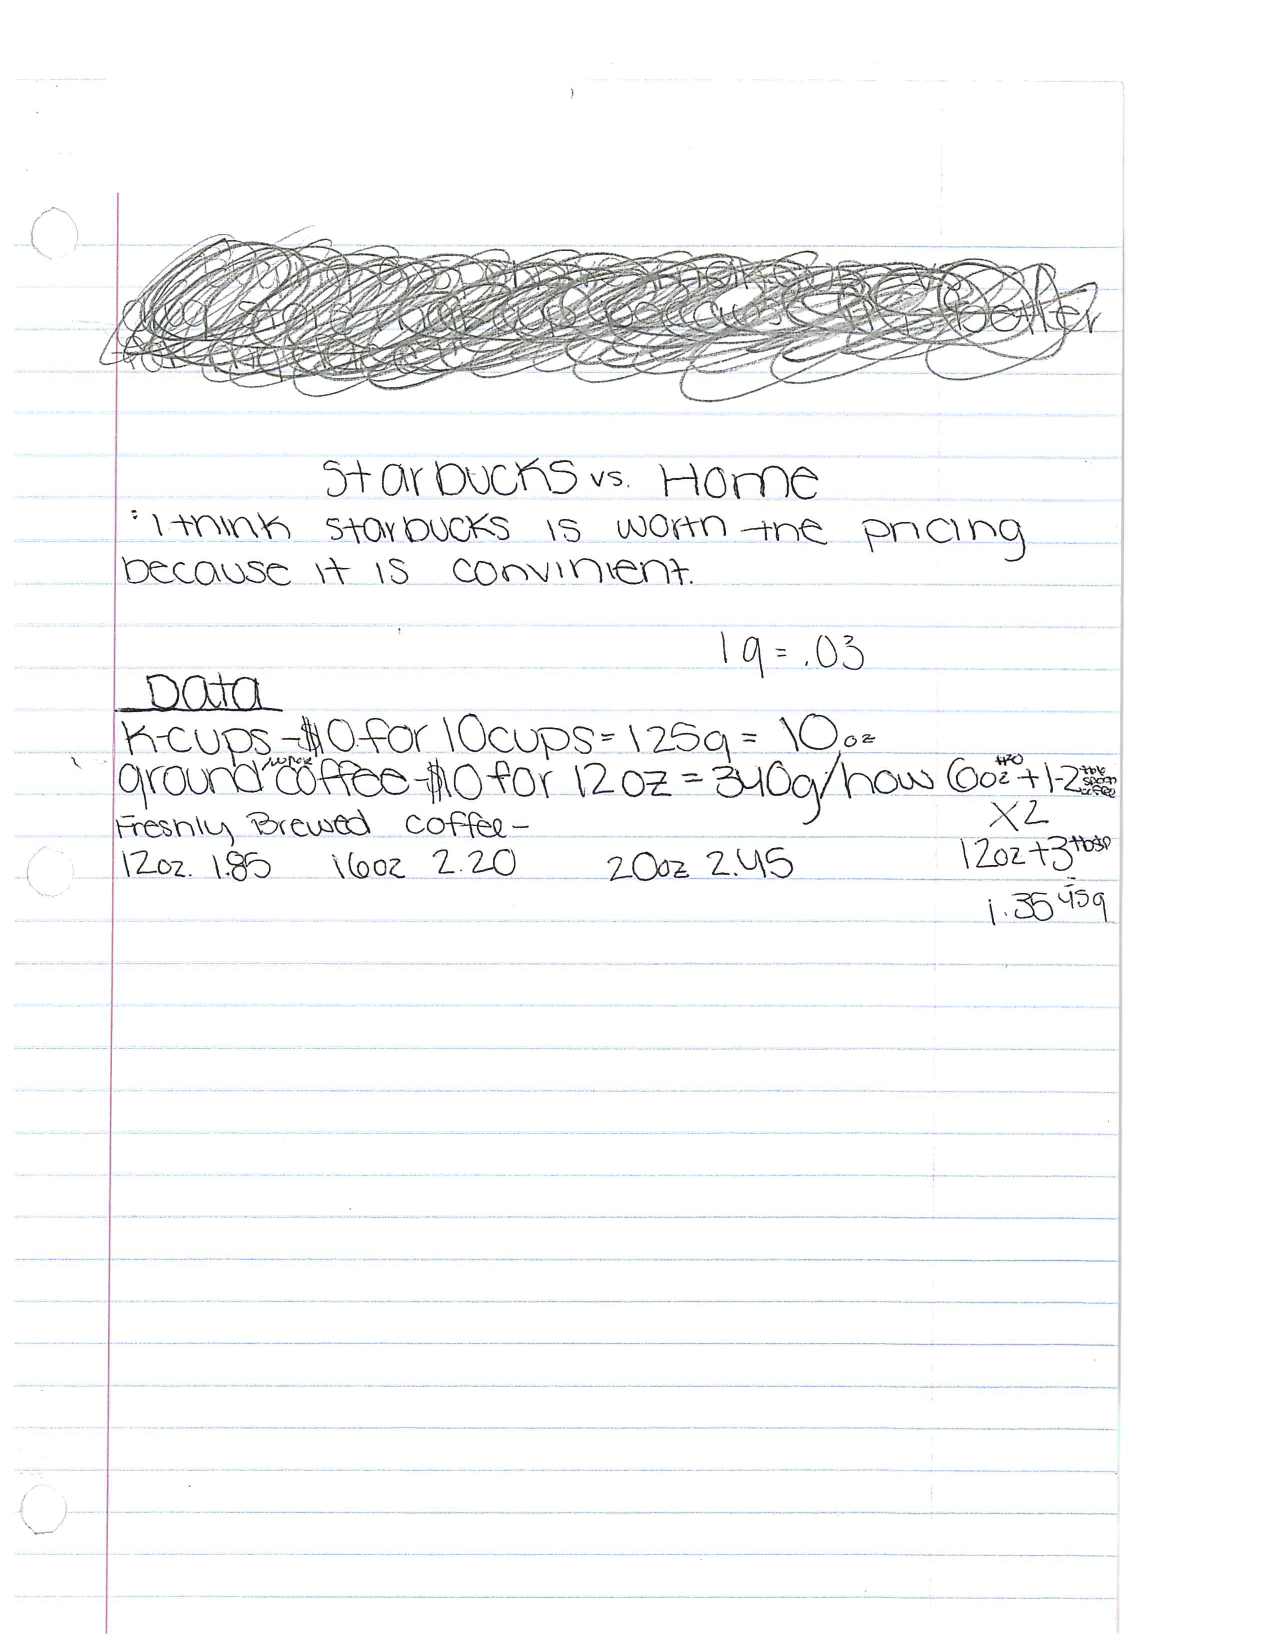
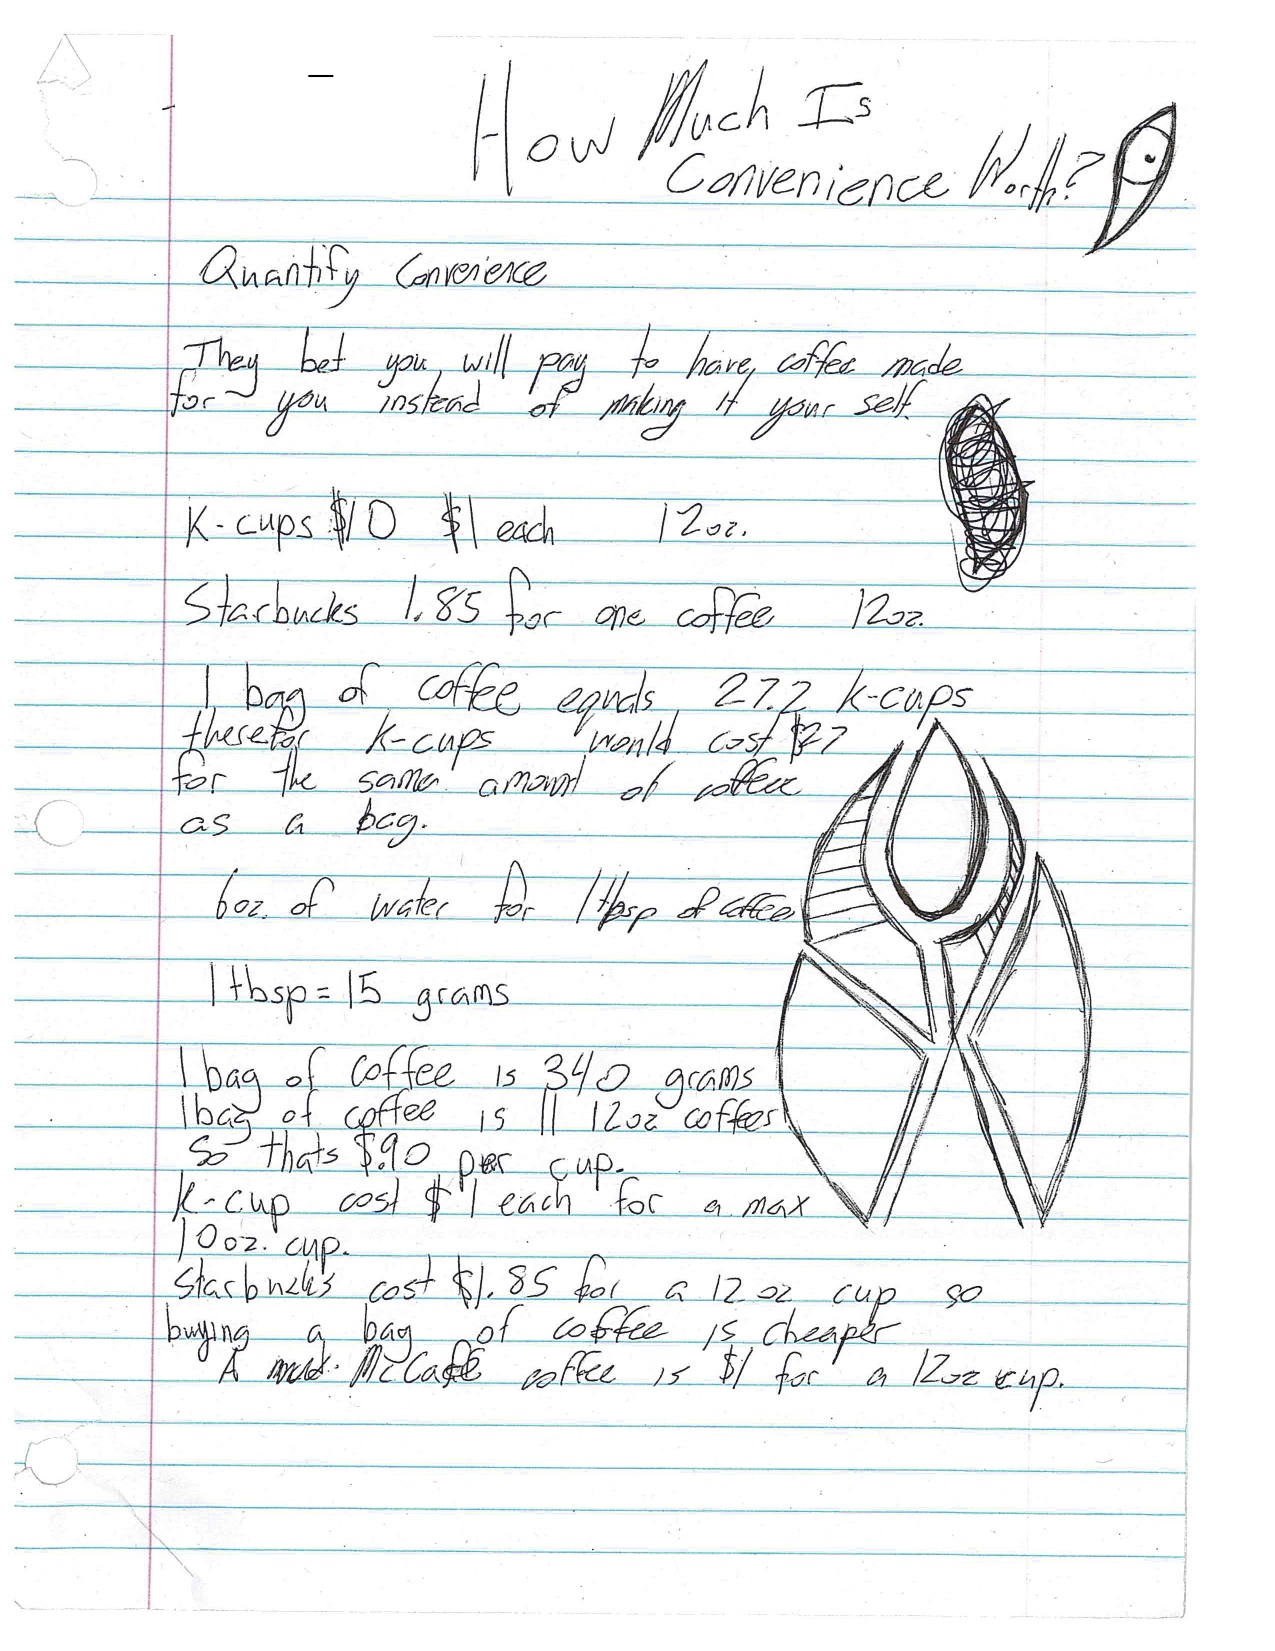
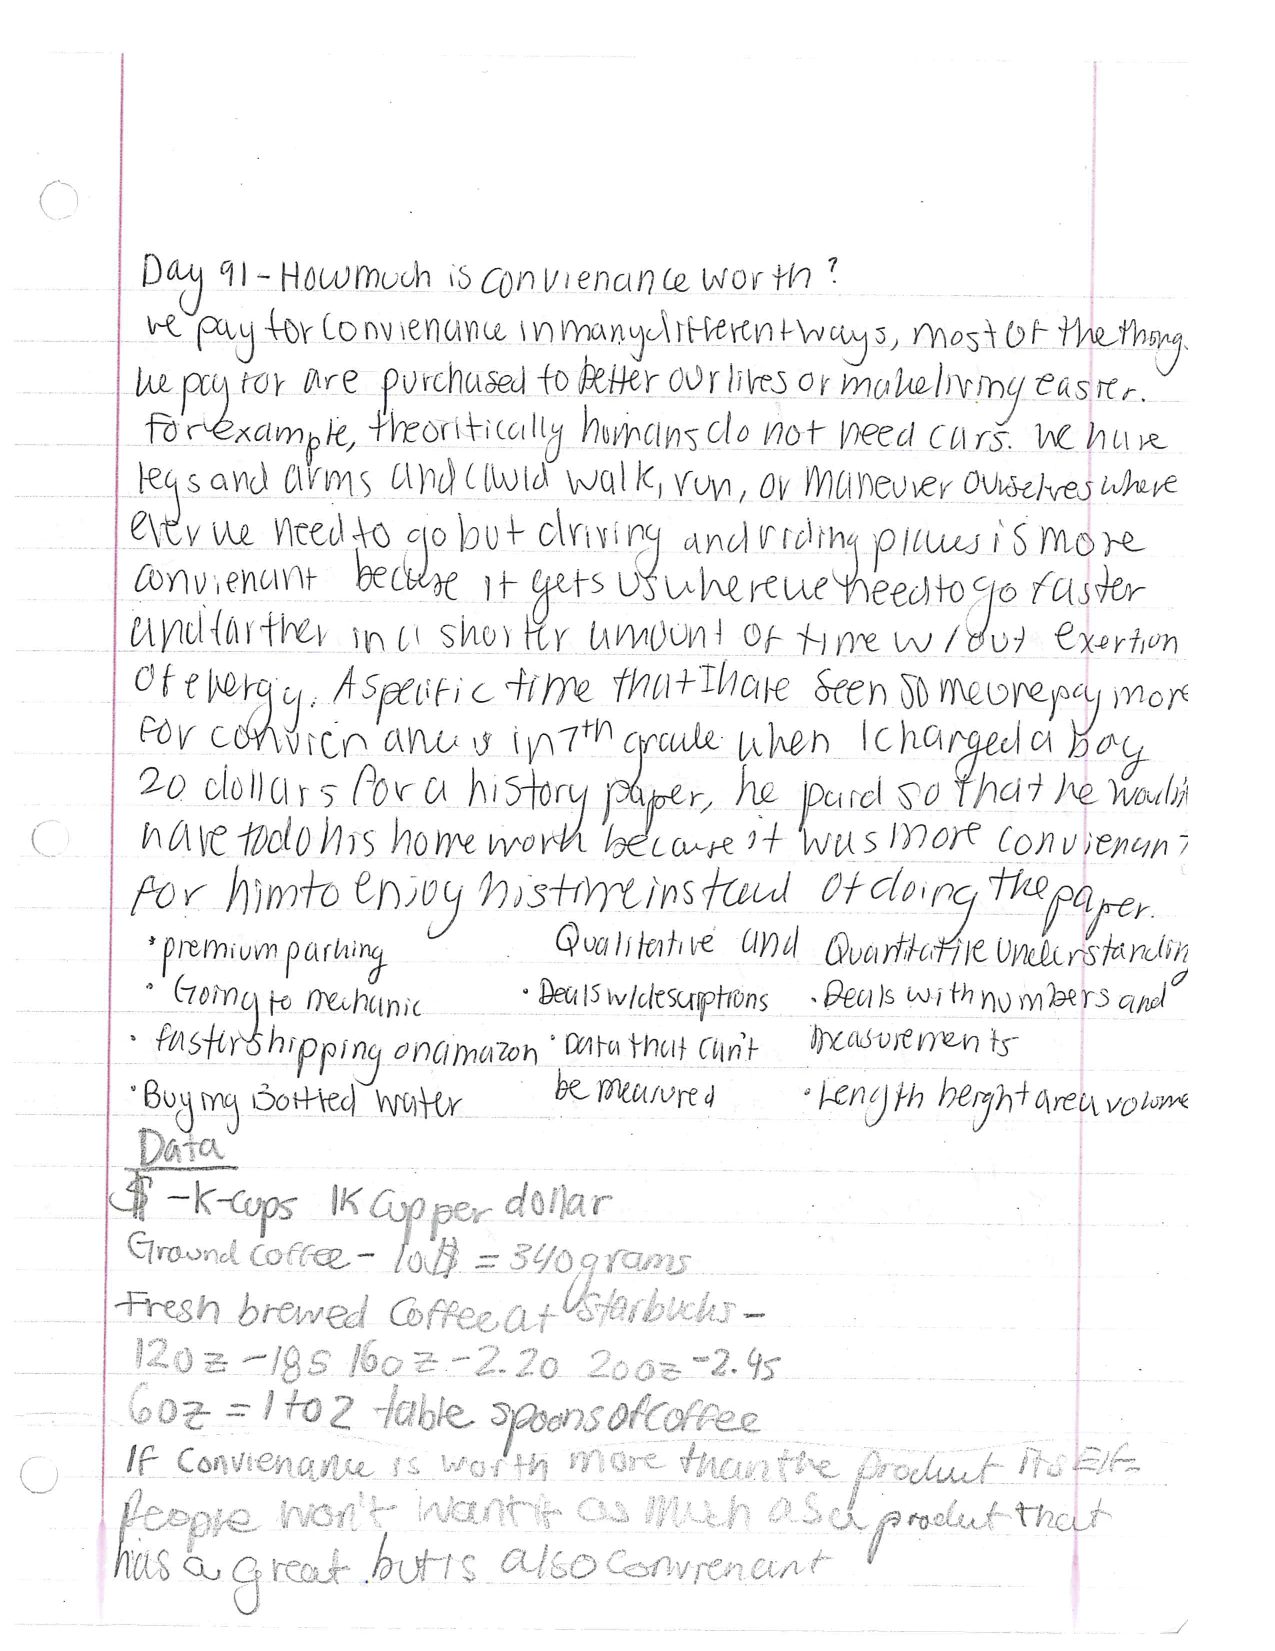
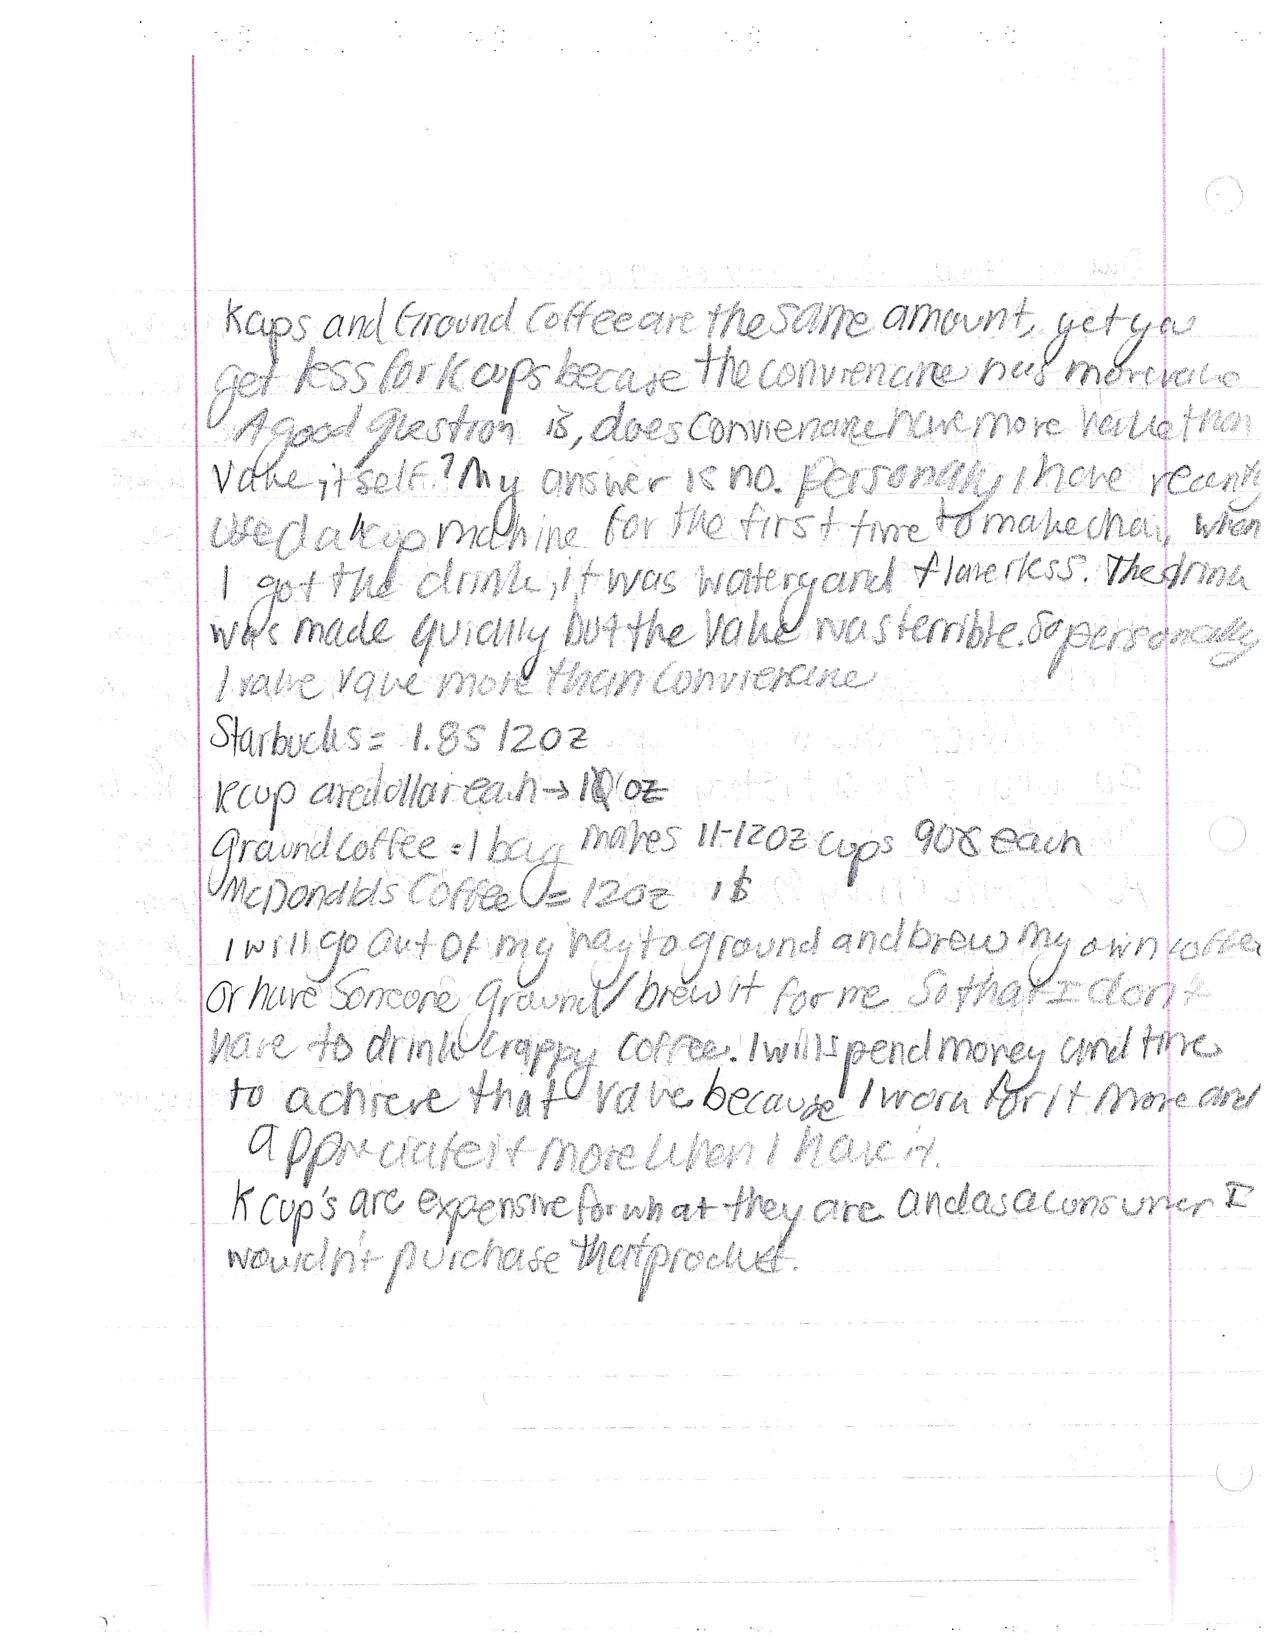
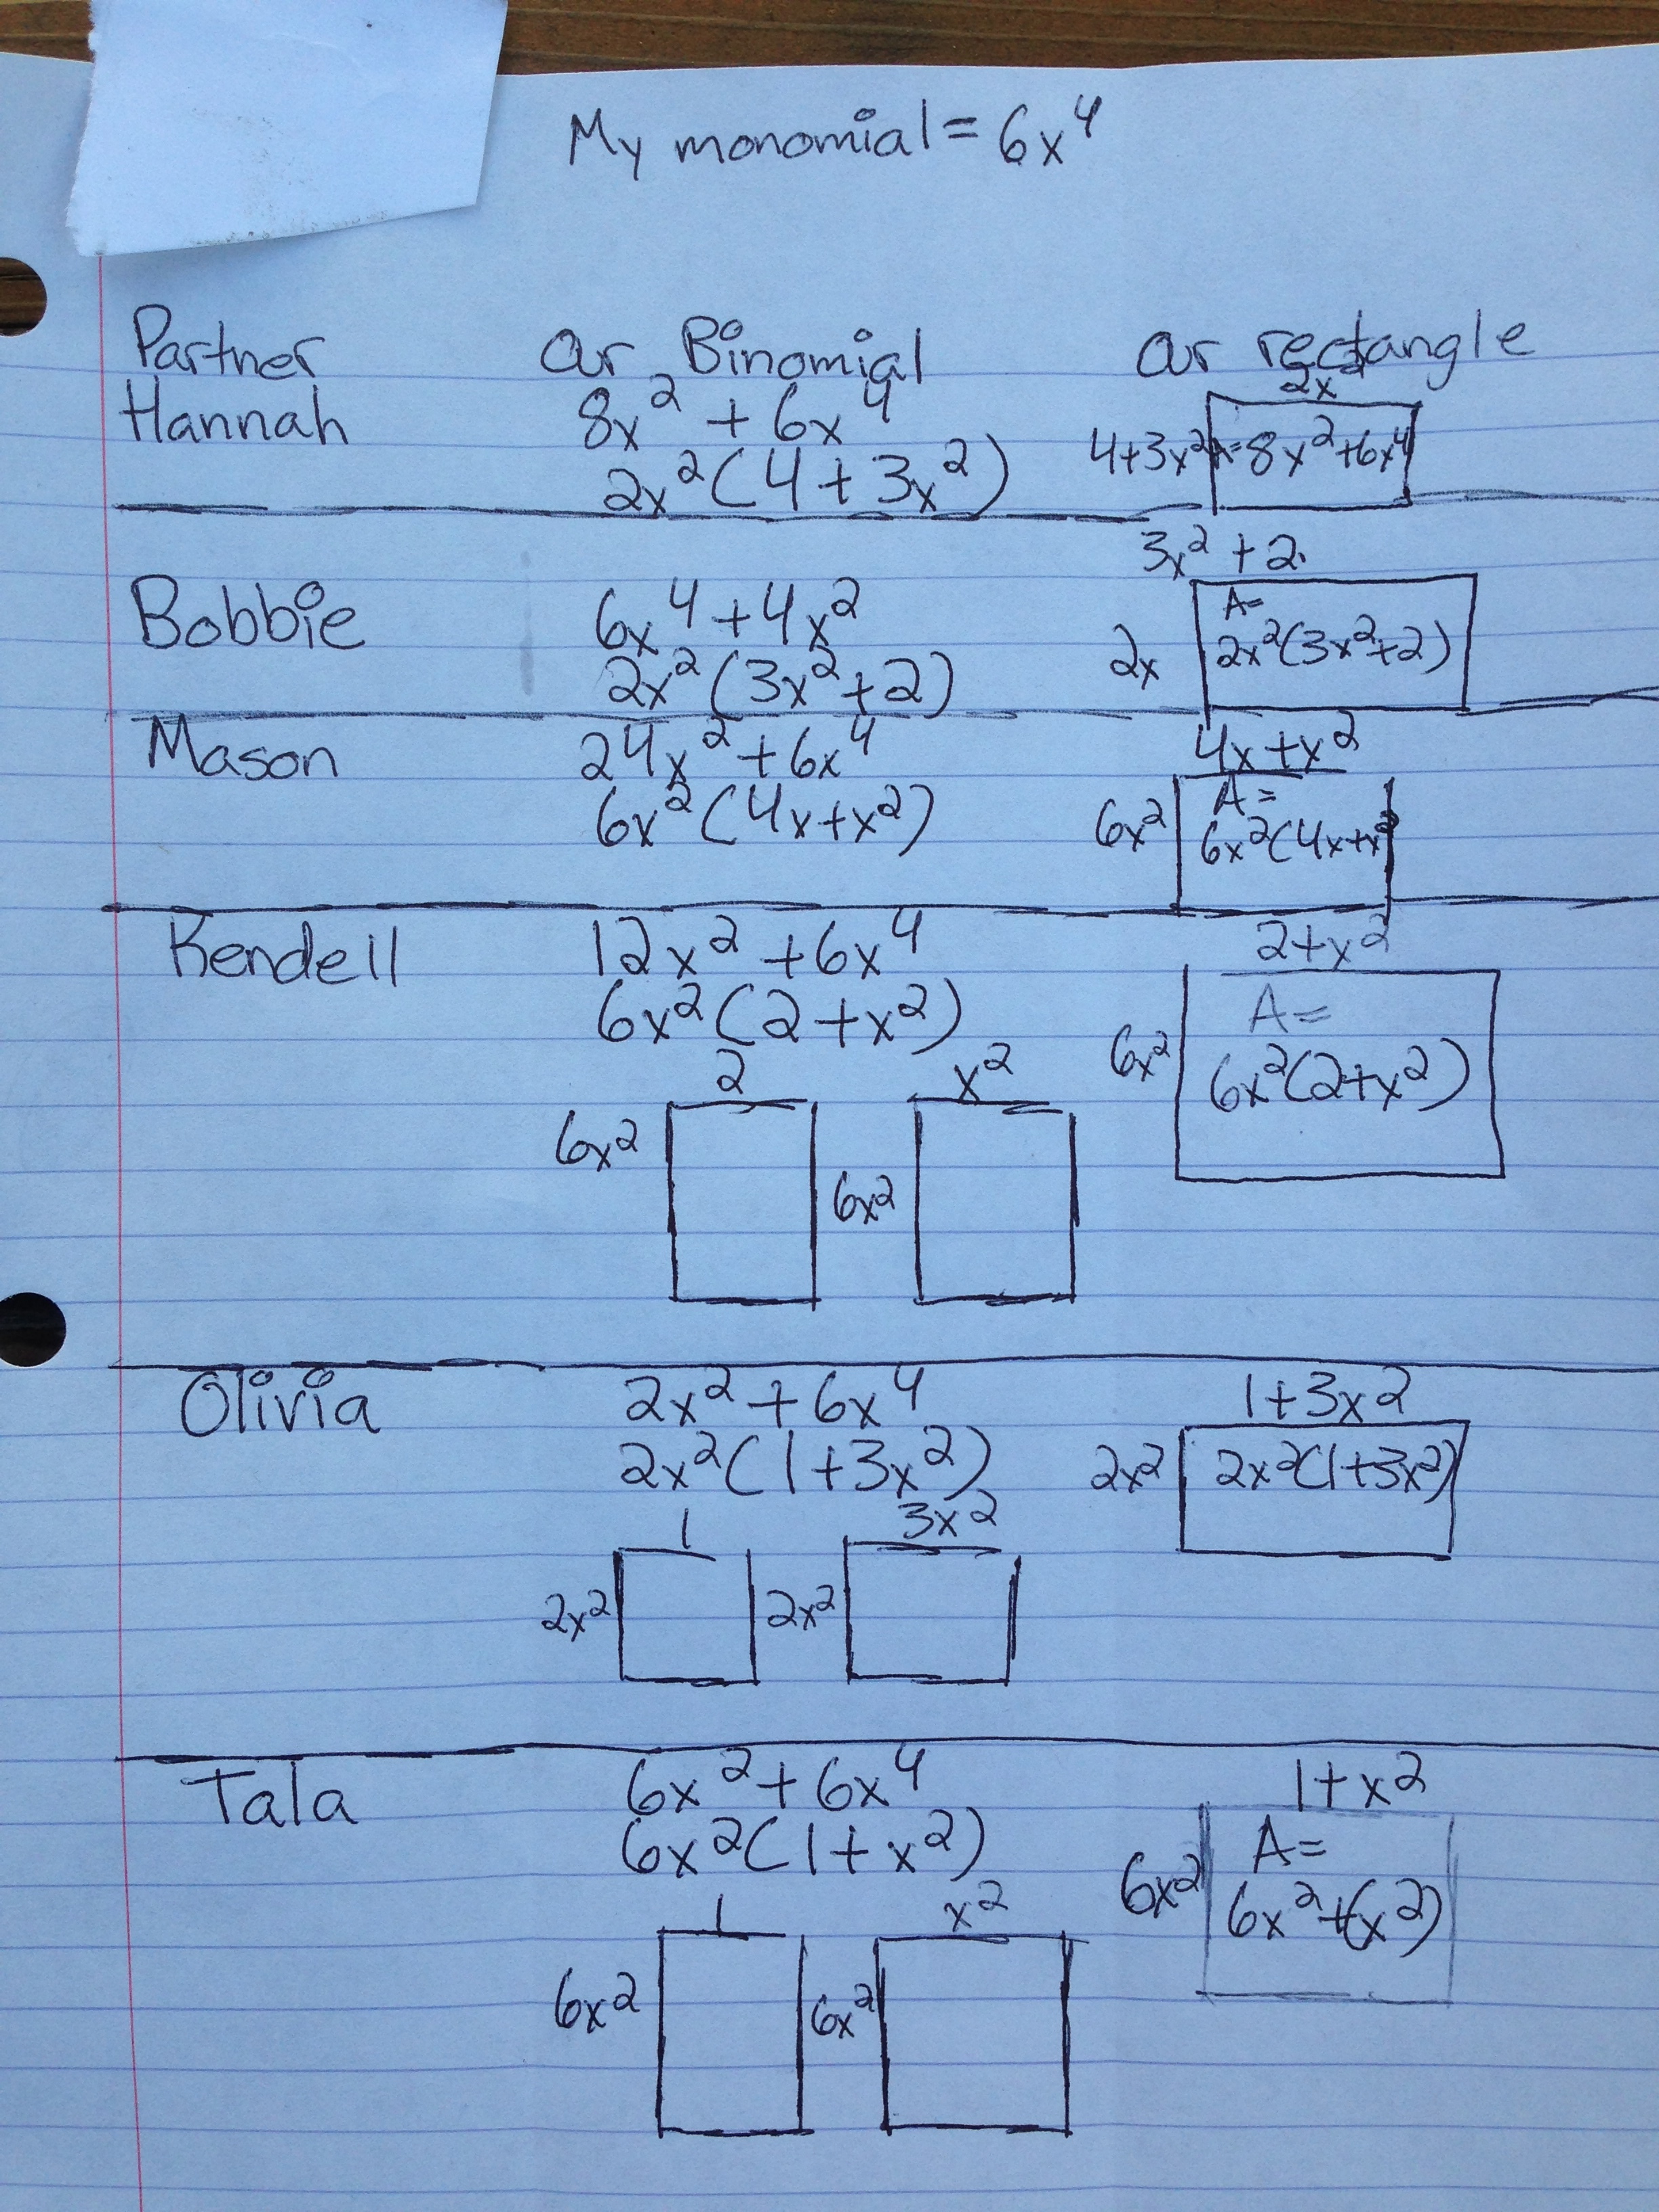
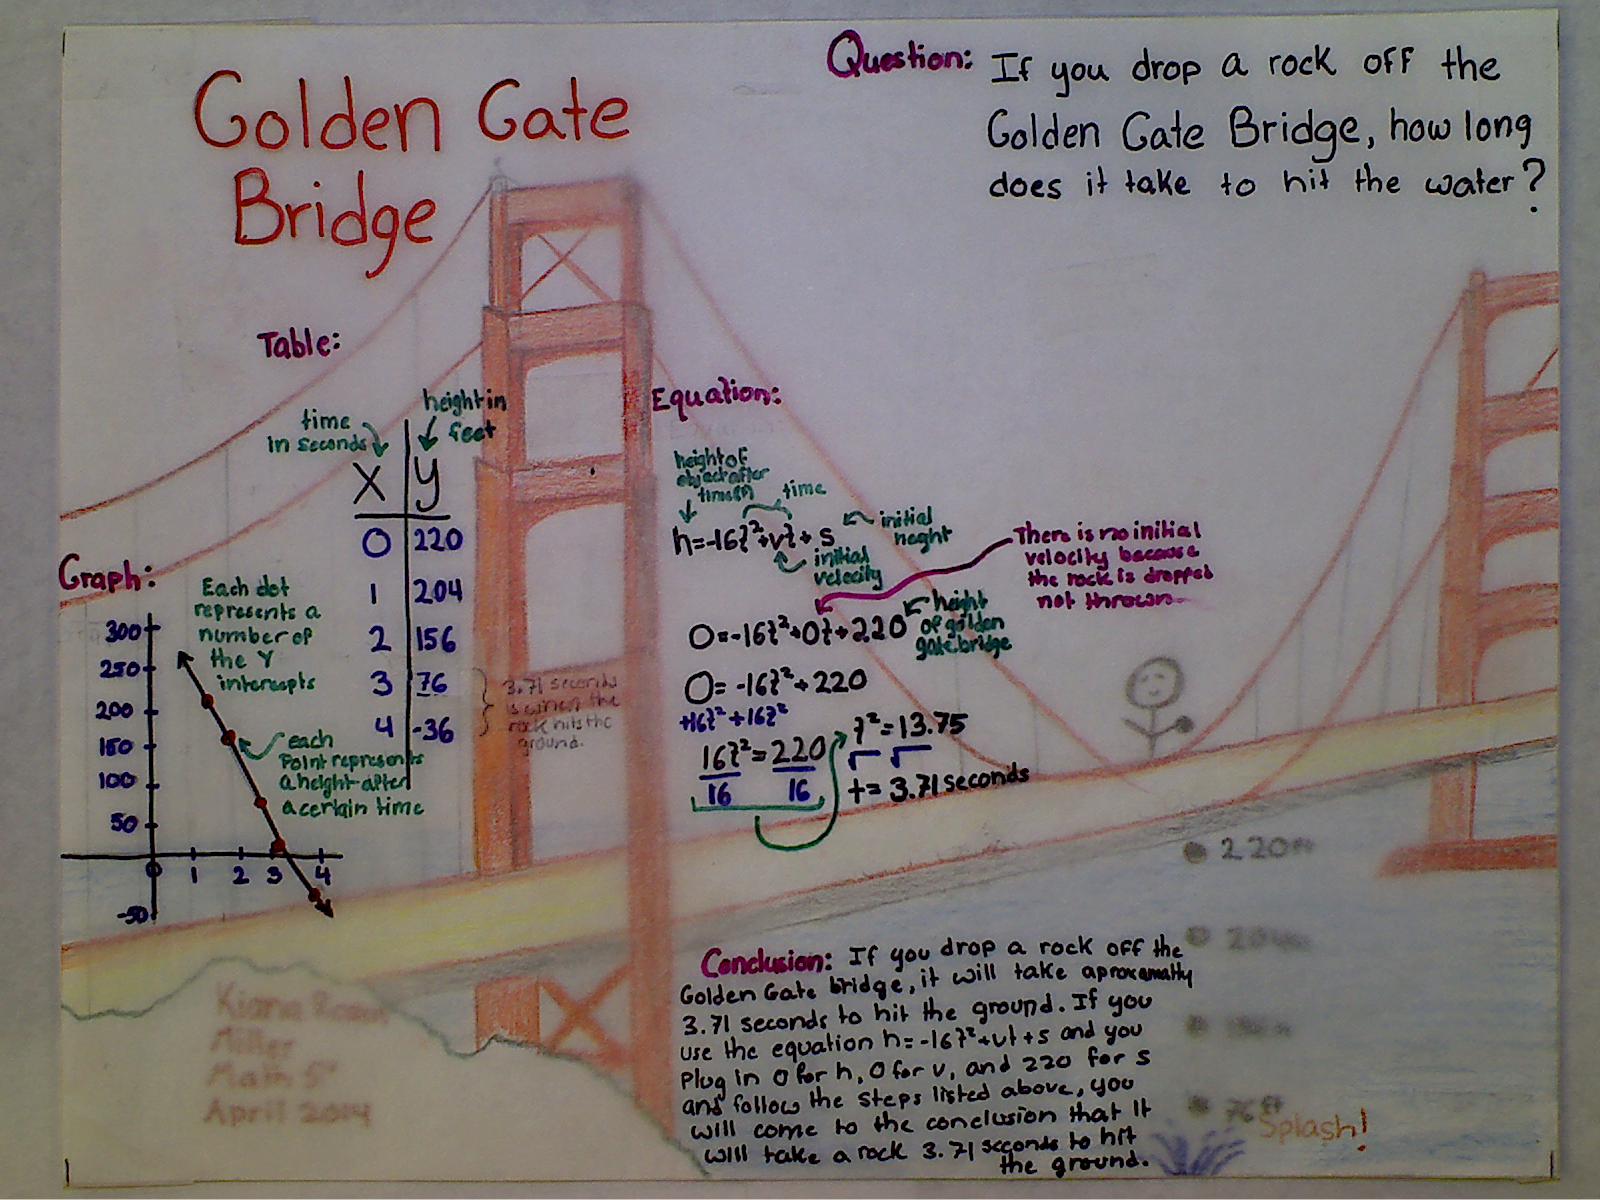
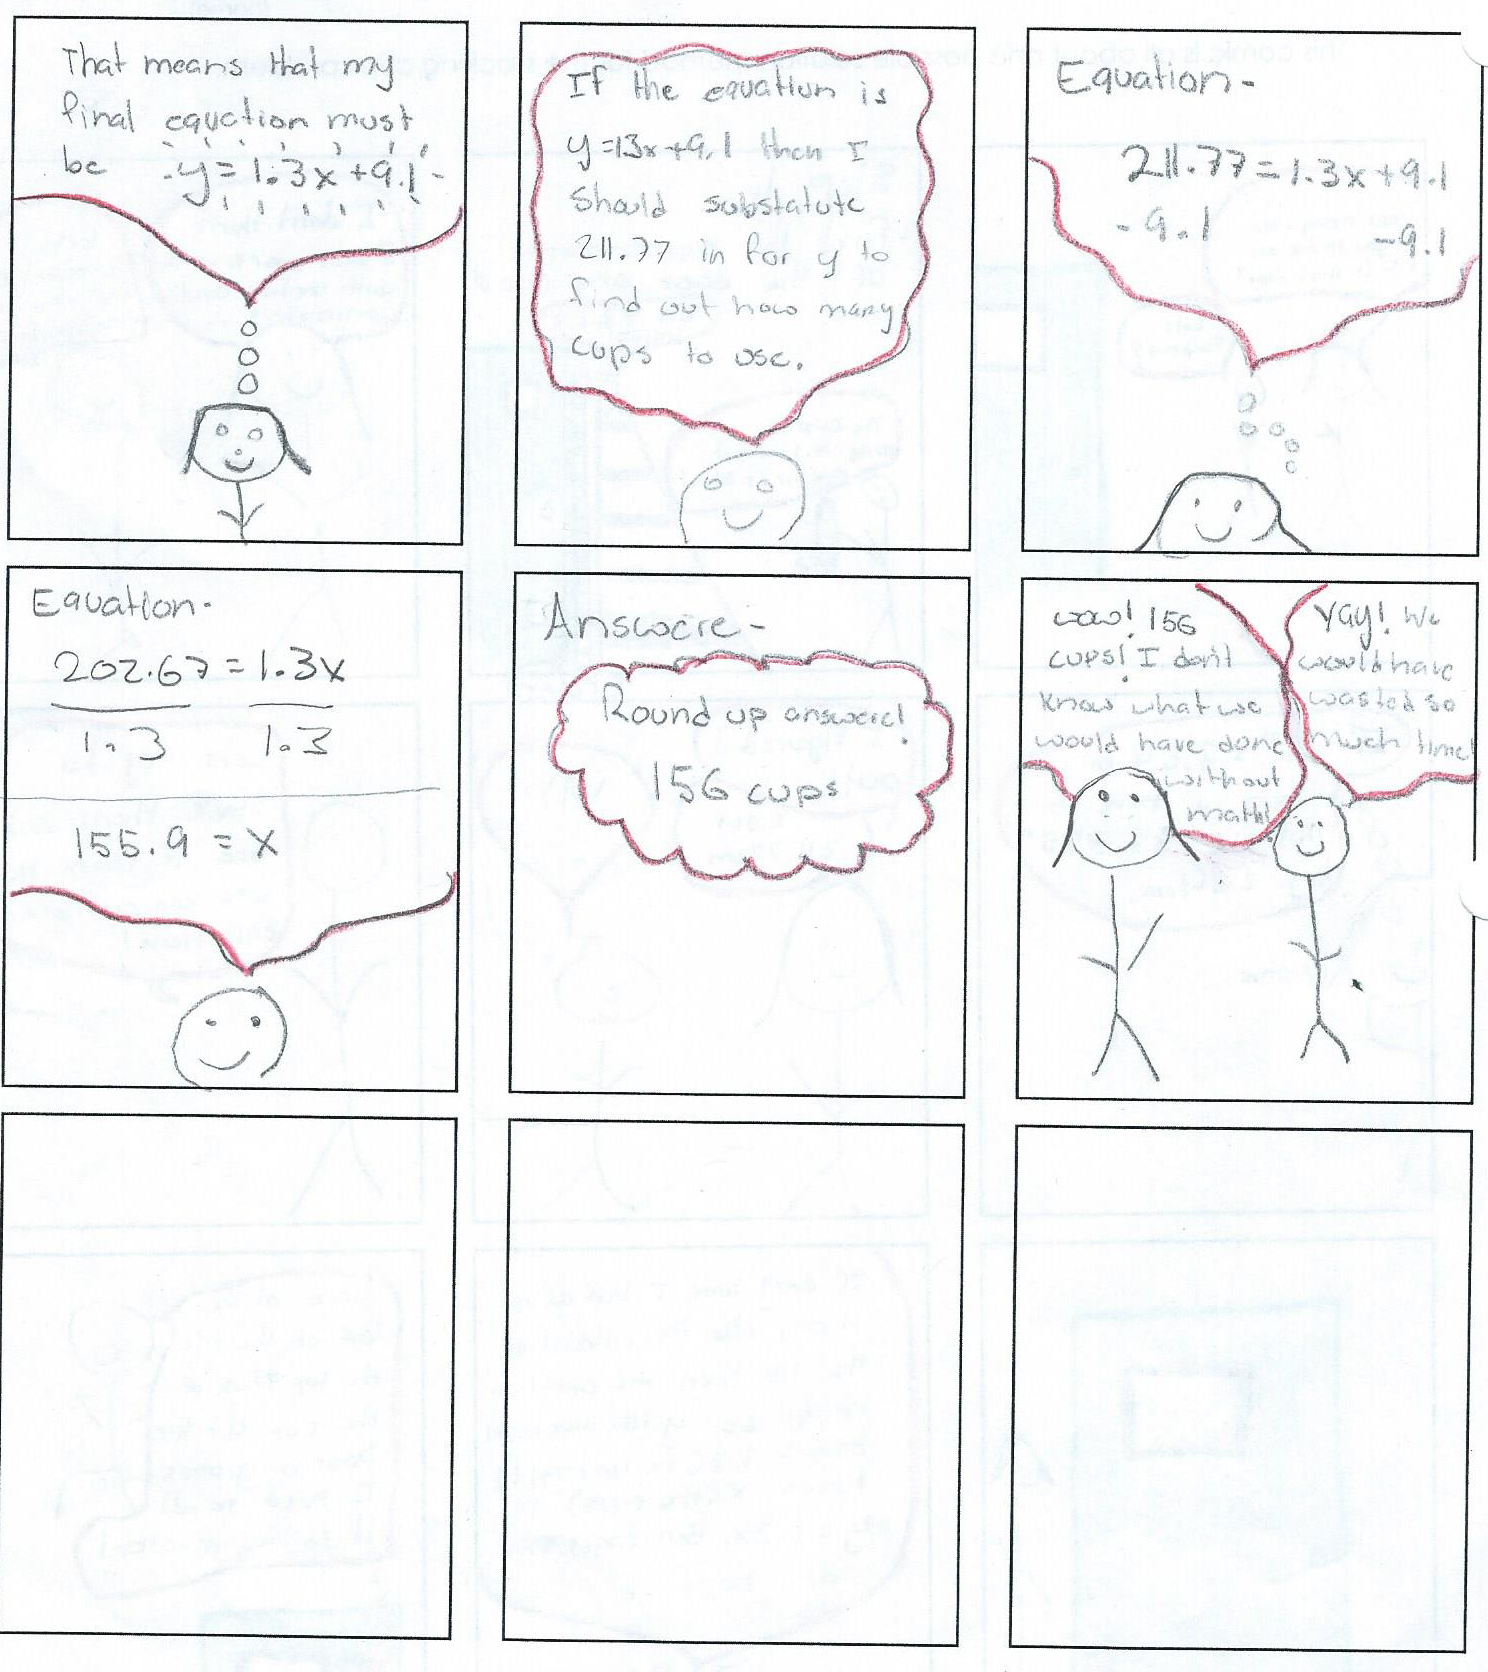
I had students just work in their notebooks, but afterwards I had them formalize their work and create a solution guide.  I will probably write about these solutions guides next – but for the time being, here are some nice ones:

Student1

Student2

The Reflection:

I am most excited about the idea of these solution guides.  It was kind of a last minute idea I threw together, but turned out kind of gold for me.  Ended up doing a gallery walk and have great classroom talks about what THEY liked and disliked about each others guides.  I”m looking forward to see the quality of the next round of them!  Bring on the “Guess What I Heard?” problem!!!

Real World Math: Project Manager

When I first started this blog the idea was to categorize assignments based on a series of twitter style hashtags, which would ultimately allow a teacher to quantify how differentiated their lessons had been – in a macro sense at least.  I have not really stuck to that idea, but one of the original hashtags I had was #industry.  The purpose of #industry was pretty simple – someone had to do this in their job.

I was hoping that #industry would end up as a collection of problems that come directly from people’s  work experiences.  These experiences would be served to student’s unedited from the workplace to the classroom.  Inherent in this hashtag would be the answer to the question “why?” because presumably anybody doing something for their job would have a clear reason as to why they were doing it. (presumably?)

So here’s the problem:  My fiance is a project manager and she had one site that was 3/4 an acre and a price from that site for $54,000 for some work. Then she had another site that was 2.5 acres and needed to know how much that same work would be for the larger site.  That was the first thing she needed to calculate, but she ended up just wanting to know how much 1 acre was worth, so she could scale it to all her other jobs.

Here’s an error analysis angle to this question –  To scale the cost for 1 acre she had initially multiplied 54,000 by 1.25 and she was genuinely curious about why that did not work.  Hhhhmmmmm…


Missing Assignment Buyout Program

The Overview:

This year I wanted to do Kyle Pearce’s Detention Buyout Program that Dan had highlighted in his Great Classroom Action series.  The problem was that in my new school we don’t have detentions, so I didn’t think I would get much buy-in from the students.  But there is something that all schools definitely do have:  Missing assignments!  So I created three “deals” that would allow students to pay me money in exchange for getting credit for an assignment they missed.

I used this assignment as an introduction to inequalities, but I also wanted to link the Missing Assignment Buyout Program to the linear equations we just finished covering.  That is the why as you look at this assignment, you will see a focus on connecting the information in the graphs to the information contained in the inequalities.

I sequenced this by first giving the assignment.  Then two days later I did another version of it as an opener / warmup.  And then lastly I put another version of it on their test.  Each new version offered slight modifications from the previous.

The Description:

I first offer students three possible deals for buying off their missing assignments.  I poker face the whole thing and enjoy all the “Is this legal” expressions on their faces.  I tell them to make sure they go home and talk to their parents about how much money they have budgeted for such as program.  The first question on the worksheet asks them which deal is better for them, so as an added bonus I printed out each students missing assignments and handed it to them.  This is that first worksheet:

MissingAssignmentBuyoutProgram_Page_1

MissingAssignmentBuyoutProgram_Page_2

There are a lot of interesting questions and explanations that came out of this first assignment.  For instance, having students see that x less than 5 was the same as saying x less than or equal to 4 since x could only take integer values.  Also having students see the connection between the intersection points of their graphs and the inequalities they wrote was time well spent.

A couple days later I came back to the Missing Assignment Buyout Program in the form of a opener or warmup question.  I handed the students this graph when they came into the room (two graphs per page to save paper):

MissingAssignmentBuybackProgramOpener

Then I had students write a description of each deal, as well as the inequality and equation for each deal.  This was a slight inversion of the original assignment where I gave them the description and had them write the inequality, equation, and then graph.  Now I am giving them the graph and asking them to write the description, inequality, equation.  I have them in pairs and am checking homework and taking role while they work.  Then I randomly call on pair share partners and fill in the following table that I am projecting on the board:

Screen shot 2013-11-27 at 5.18.48 PM

Lastly to make sure that they really did understand the concept, I put a similar problem to the opener exercise in their inequalities chapter test.  The test had a slight twist in a scenario where a student would want to buy the Flat Fee plan based on their number of missing assignments, but based on the money they had to spend, they would need to pick their second best option.  Here’s that problem:

MissingAssignmentBuybackProgramTest

I initially thought having them graph each deal was kind of an unnatural excercise, because why would someone ever graph something like that?  But I think it ended up working because of how the Opener and Test question both refer to the graph.  All in all student engagement was high, even with the graphing portion so I think I’ll keep it next year.

The Extension:

(good idea courtesy of my principal)

Tell the students that you have decided to only offer one deal to the whole class, and they have to decide which deal they want for the class.  This could open up a nice debate about fairness and equity – this deal is best for you since you don’t have any missing assignments, but what about these other students?  Connect this debate to something current, like Obamacare.  Discuss how math influences decisions and that often decision makers have to make decisions based on their believe on the greater good, even when the numbers indicate that some people will be negatively affected by the decision.

The Goods:

MissingAssignmentBuyoutProgram

MissingAssignmentBuybackProgramOpener

MissingAssignmentBuybackProgramTest

Stacking Cups Assessment

When three of your favorite bloggers all write about the same lesson (Dan, Andrew, Fawn) it is a pretty safe bet that you should do the lesson.  I used Andrew’s 3Act video because my students can be pretty green and I might not hear the end of it if I couldn’t find an additional use for all these cups I was bringing into the class.

I don’t have anything to add to what was already said by Dan, Andrew, and Fawn, so I will just share a problem I created that you can put on your midterm that is a slight twist to the presentation of the original problem:

StackingCupsTestQuestion

1.  How many cups would stack in a 250 cm door?

2.  What are the dimensions of the cup?  Draw it and label it with the dimensions.

I suppose you could ask for the y-intercept and slope and all that stuff too if you wanted.

Moving on from test questions – The actual lesson went great for me and I am definitely looking forward to doing it again next year.  When I did this problem in algebra I had the students make a Stacking Cups comic that was supposed to describe how to solve the stacking cups problem.

SCcomic1

SCcomic2

I like the comic concept because I think this is a very visual problem, and since I didn’t provide them with actual cups they needed to create their own visuals.  I have been trying to get students to give me a visual for every word problem they do this year.  My stated reasoning for that has been that visuals help you give a clearer and more convincing justification for your solution.

In order for students to learn how to construct a viable argument and critique the reasoning of others (Let’s hear it for MP.3!!!), we are going to have to have an iterative process on a couple problems where they essentially hand in drafts, and we keep having them make improvements.  I think this is a great problem to do for that since it has a couple nice extensions for system of equations (different sized cups) and geometry (here).

Why Algebra? – The Basketball Analogy

“I think less of us would drop out if we just knew why the hell we needed this stuff”

That was said by a student who was simplifying rational expressions.  I had a positive relationship with her so the quote was simple honesty and not some veiled attempt at making a teacher feel bad by calling their job pointless.  I knew at that moment I needed to be more purposeful in my attention to the question of ‘Why Algebra?’.

Periodically throughout the year I dedicate a few minutes to tell them why Algebra is important.  I always remind them there are many different reasons, and that no reason by itself will feel sufficient because we are all such different people.  But when we take all the reasons together, the total picture will hopefully be able to answer the question for each student.   I usually start with a basketball analogy because I used to coach basketball.  It’s how I explain that you will need to use algebra in more advanced math.

We learn algebra differently that we learn most things in our life.  For example you generally play basketball first.  And then you decide you want to get better so you practice some rebounding drills.  Then you realize that you need to be able to dribble the ball and you start doing ball handling drills.  Algebra is typically constructed the other way around.  We practice algebra drills without ever playing math – essentially we are practicing dribbling drills without ever playing basketball.  This of course is not always true in algebra class and we are playing math as much as possible in my class – but I’m not trying to spend a lot of time in gray areas to make this point.

With that setup I show the students this video of MIT Instructor Lydia Bourouiba (I begin it at the 1-minute mark) going over a Separable Equations problem in a Differential Equation class.

[youtube http://www.youtube.com/watch?v=76WdBlGpxVw]

There are multiple places in this video where she does algebra steps.  Like at the 1:09 mark when she puts all the y-variables on one side of the equation, and the x-variables on the other.  Except she doesn’t show any of her work, she just does it.  In basketball you don’t think about how to dribble, you just dribble.  So here I pause the video and do that step like we would in our class, I multiply both sides by dx, canceling the dx’s on the left.  Then I divide both sides by y^2, canceling the y^2 on the right.  Students are surprised to see that they understand something Lydia is doing, and also wondering why she didn’t show her steps like I did.

I end up pausing the video in several places.

I’m basically showing the class that someone in a multivariable calculus class is using the exact things we practice.  Except that the algebra she uses is not an end unto itself – rather it is another step towards a greater purpose.  She is using algebra in the process of resolving a larger question.

Here’s an exchange I had with a student after I made the points above:

MM – “Similarly, in basketball you practice your cross over dribble because its going to help you in the game.”
Student – “Yeah Mr. Miller, but how are we suppose to remember what we are doing here 10 years from now?”
MM – “Do don’t have to remember it, because you’ll just do it.  When you are playing basketball you don’t remember that first dribbling drill you did 10 years ago.  You just dribble.”

And I shit you not – I saw and heard multiple aha moments around the room.  And then the closing line:

MM – “I know what you are all thinking.  I know if I was you, when I was your age, I would be thinking to myself ‘That’s fine but I still don’t care because I am never going to take that class.’  (pause for laughter and general agreement from the class)  But you never know.  I ended up taking that class”.

That takes a few minutes – and then I begin the days lesson.  Are students instantly motivated?  No.  But at worst the student who honestly thought there was no reason – now knows there is some reason.  Maybe they don’t think that reason applies to them, but they know its there.  And if your students do not embrace the unknown quality of their futures; embrace the fact that they don’t know where these open doors lead – then your job as a motivator is not done yet anyway.