Visual Patterns and VNPS & VRG!

I feel like I’ve been preaching the gospel of vertical non-permanent surfaces and visible random groups everywhere I go these days.  The norm is set in my room – I pose the problem, give them a couple minutes of silent thought, put them in groups, and away they go.

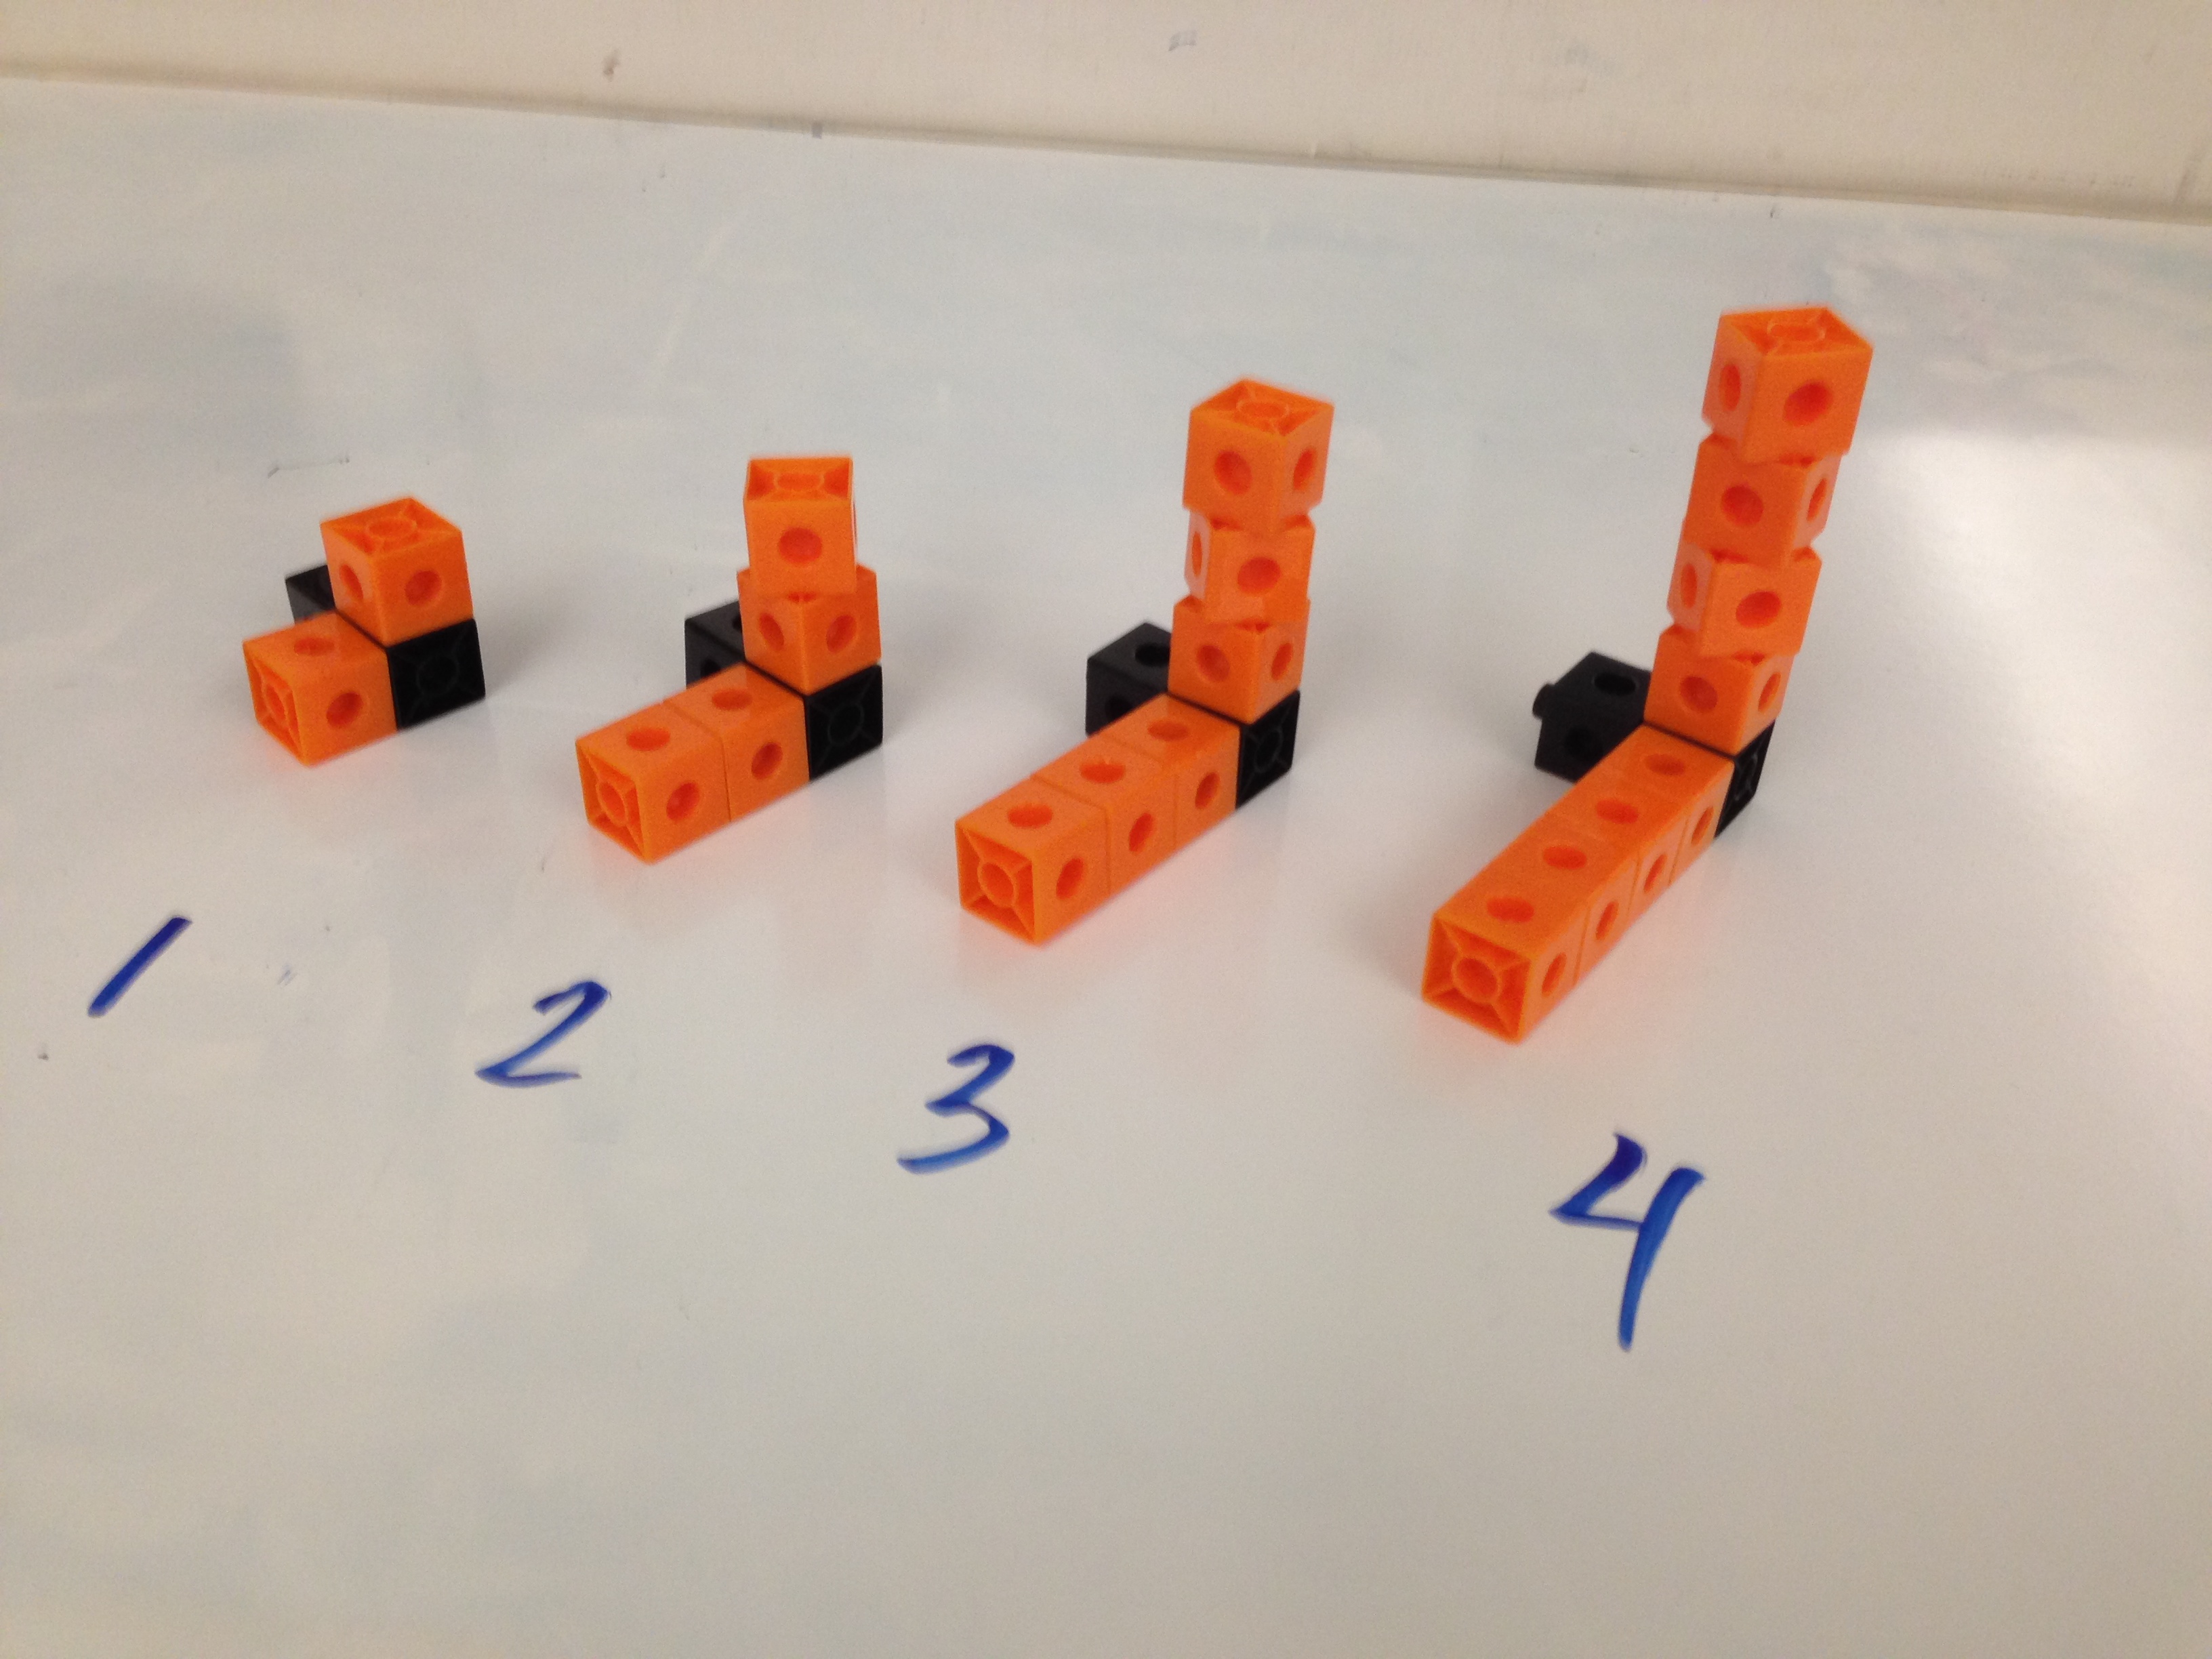
Below is a pattern I made up quickly one morning.  It doesn’t look exciting – but guess what?  It’s doesn’t have to be.  It was close enough to full class engagement for me, which was due to a nice combination of:

1.  They believed they could do it.

2.  Vertical non-permanent surfaces and visible random groupings.

3.  Probably some other things I can’t quite pin down yet.

IMG_2157

I’ve settled on these as my go-to questions for visual patterns.  I know I got the sketch the 10th idea from Fawn’s blog.  I never used to have them do that but when I started requiring it I was impressed with how helpful it was for a lot of my students when they ultimately wrote the equation.

1.  Sketch the 10th

(helps them immensely when writing the equation)

(sketches aren’t exact drawings.  I tell them I should be able to have them sketch the 1,000,000th)

2. How many blocks are in the 49th?

(too big for a table!  For students struggling to write an equation, having them sketch the 49th usually gets them to get it)

3. How many blocks are in the nth?

(I start the year asking it this way:  “Write an equation that relates the step number to the number of blocks in that step.  (another way to ask this question is:  How many blocks are in the nth step?)”

I would literally have that parenthesis in each problem, until I finally got to drop it.)

4. What is the largest step I could build with 1000 blocks?

The first extension.  My true goal here is the equation in #3.

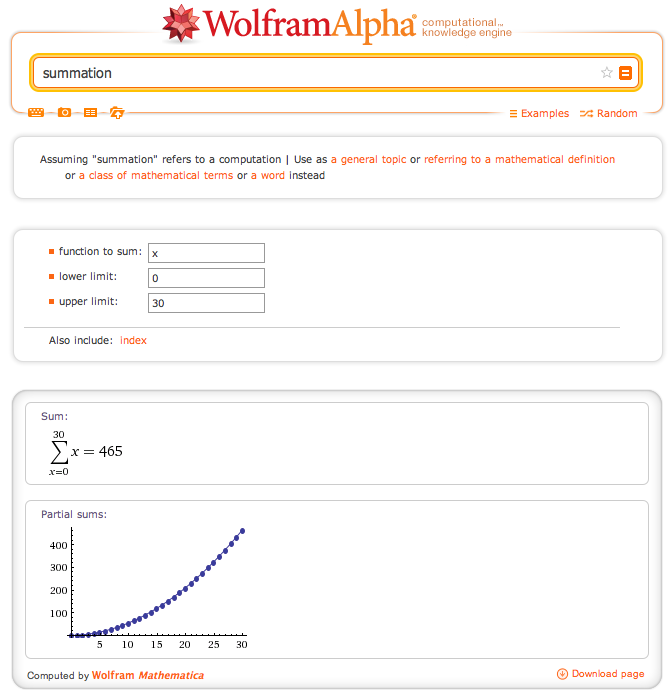
5. How much of the sequence could I build with 1000 blocks?

 A second extension.  It’s quadratic and I haven’t directly covered quadratics, so it will challenge those kids.  We have talked about Gauss addition so it is not completely out of their range.

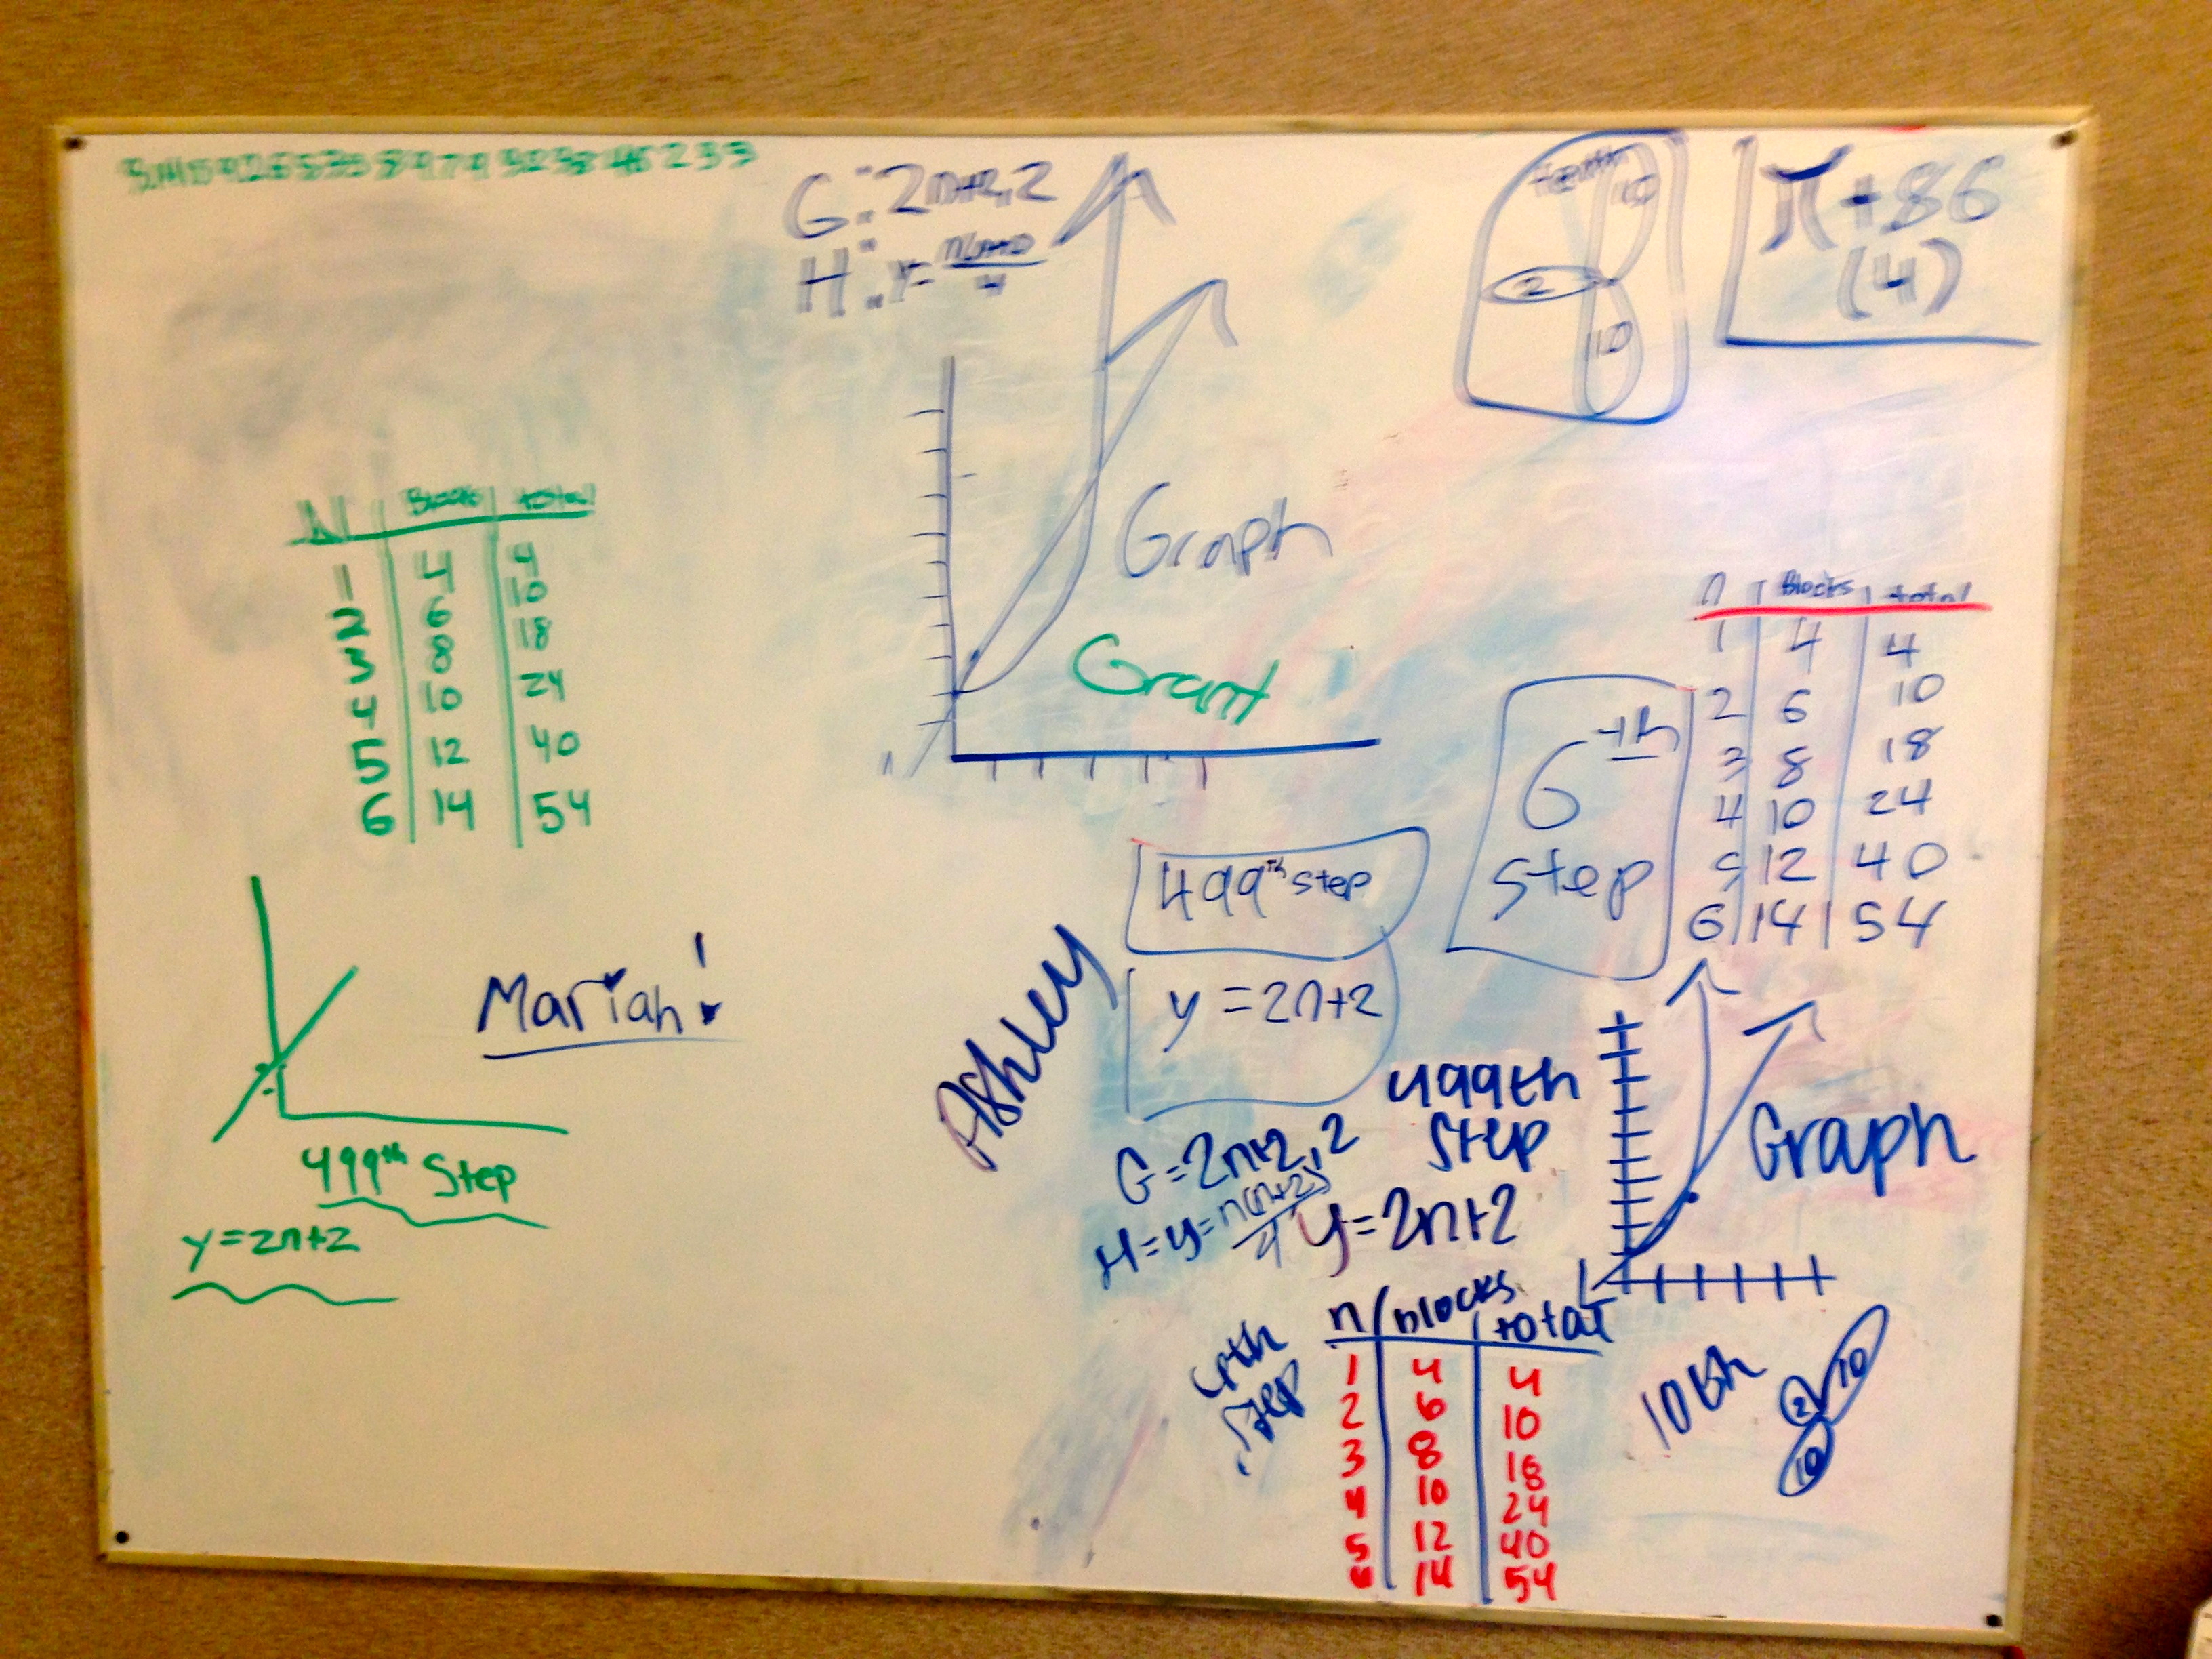
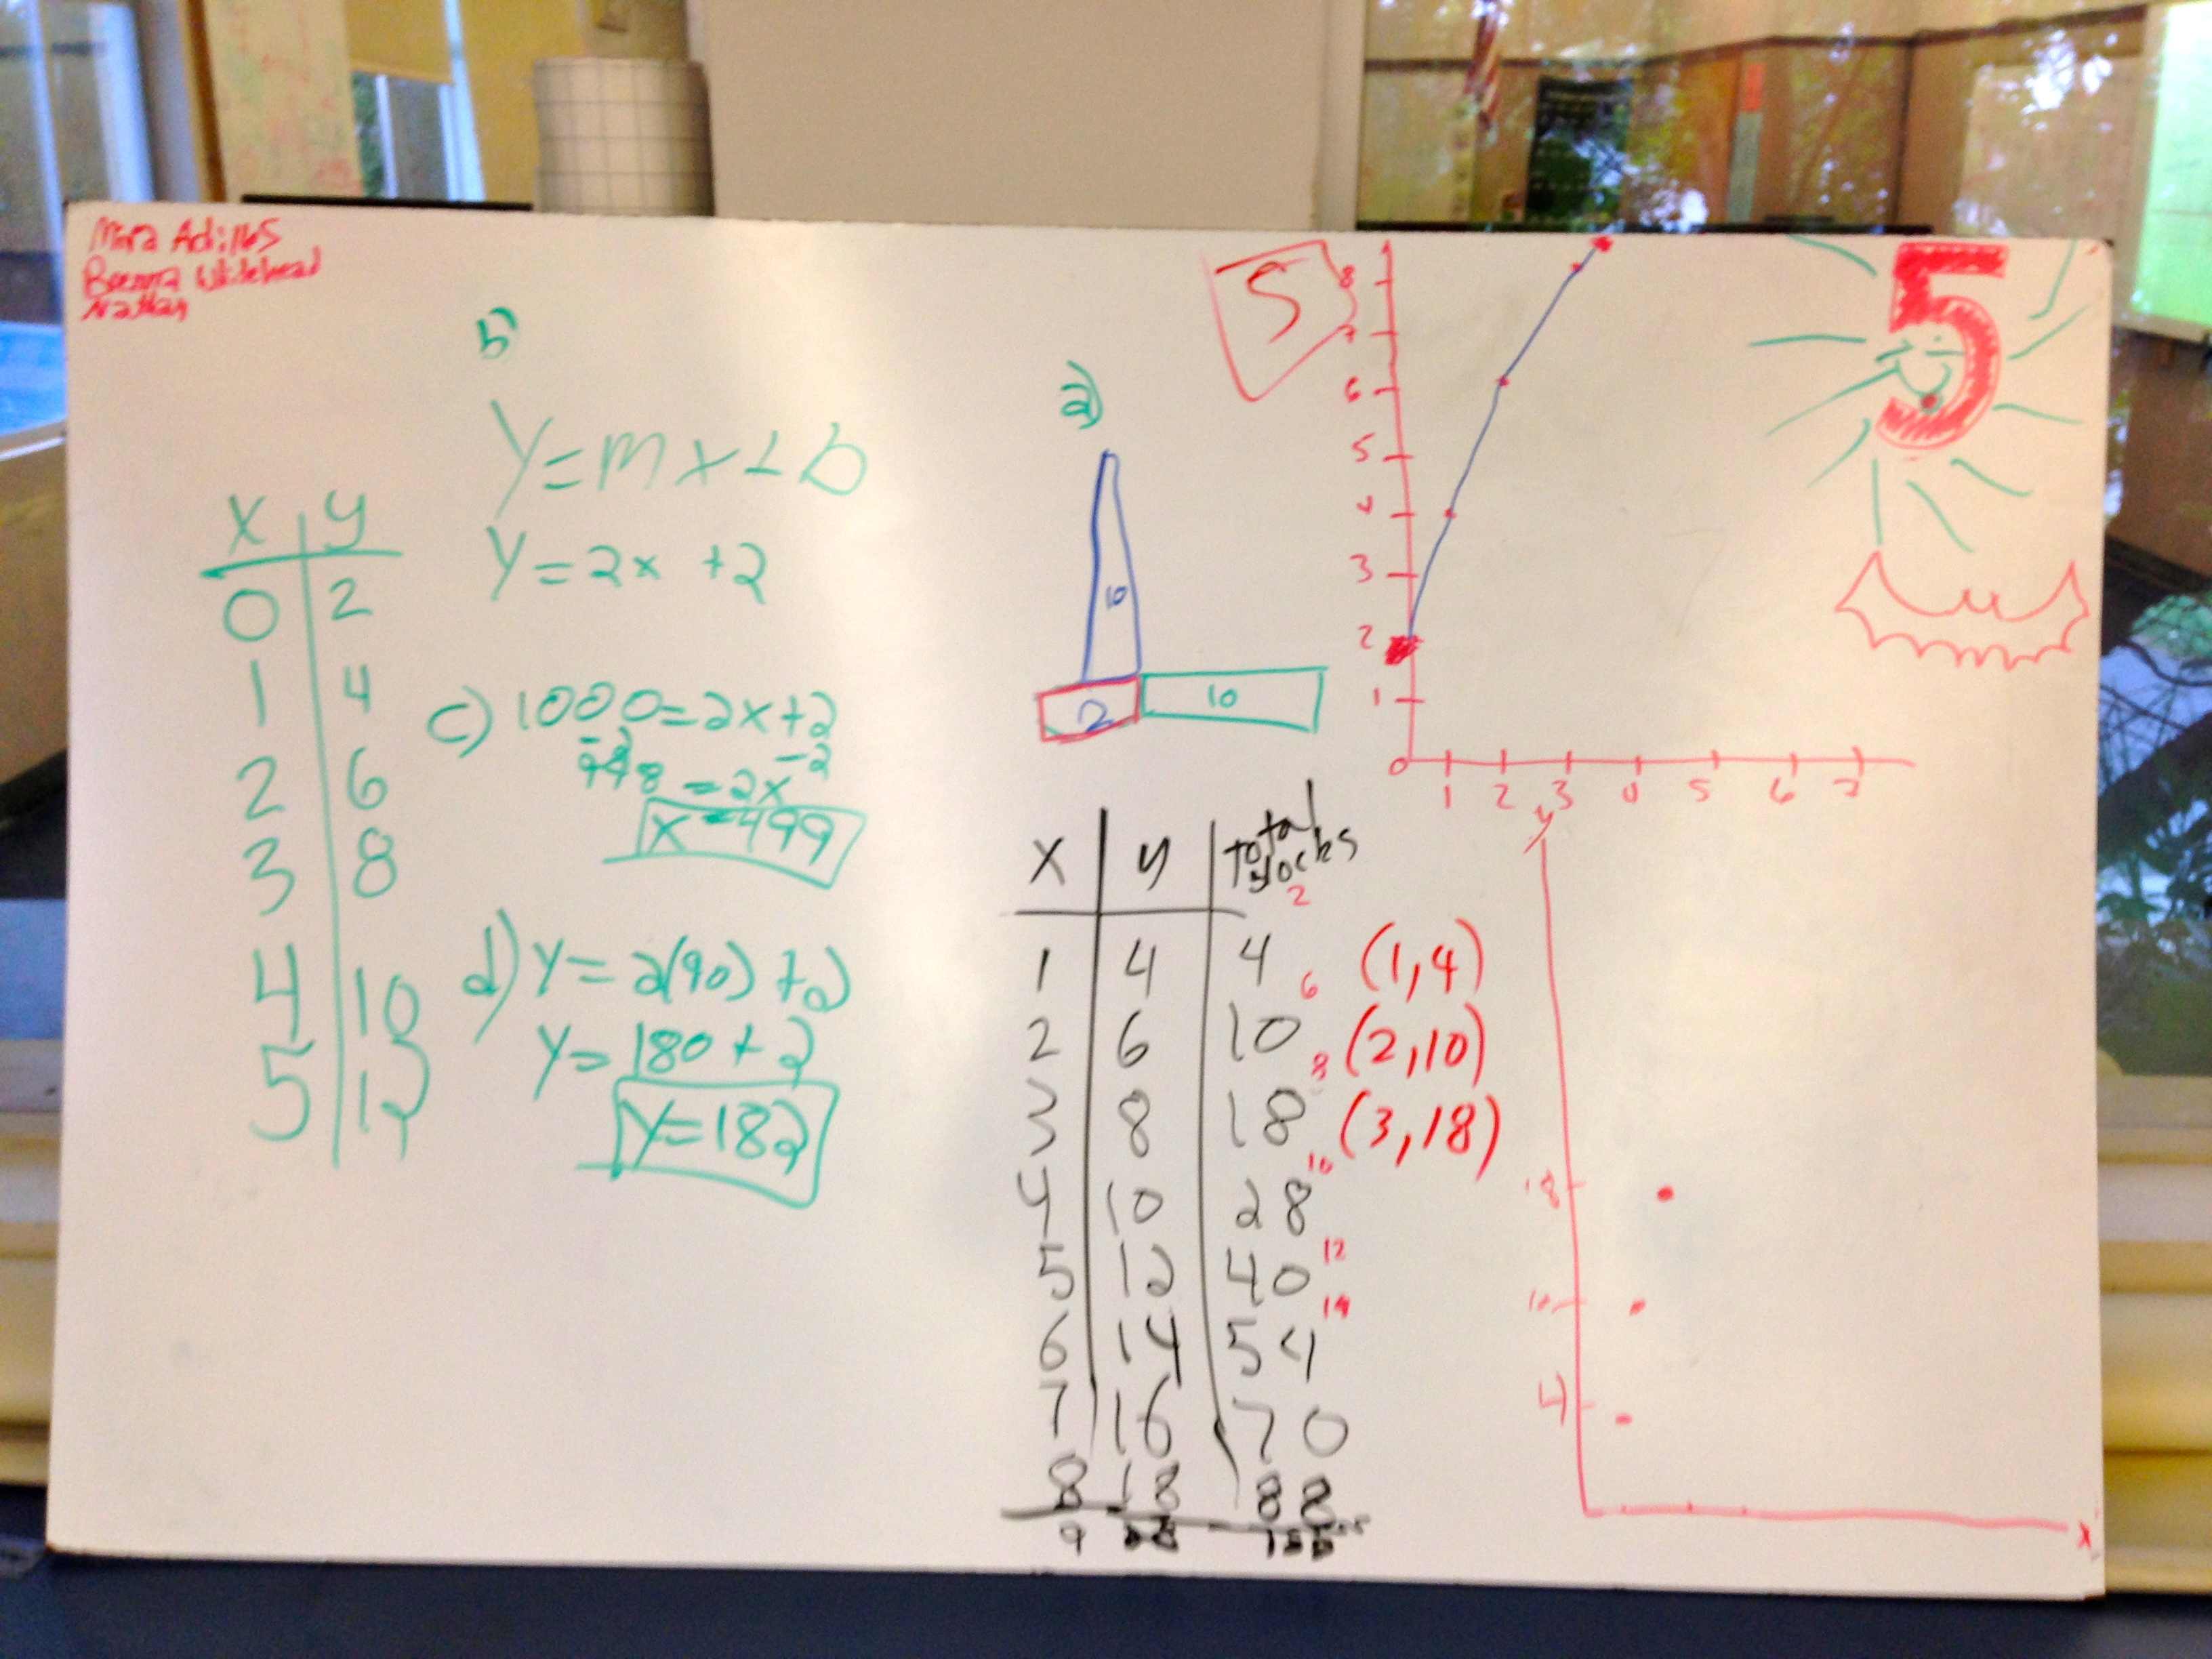
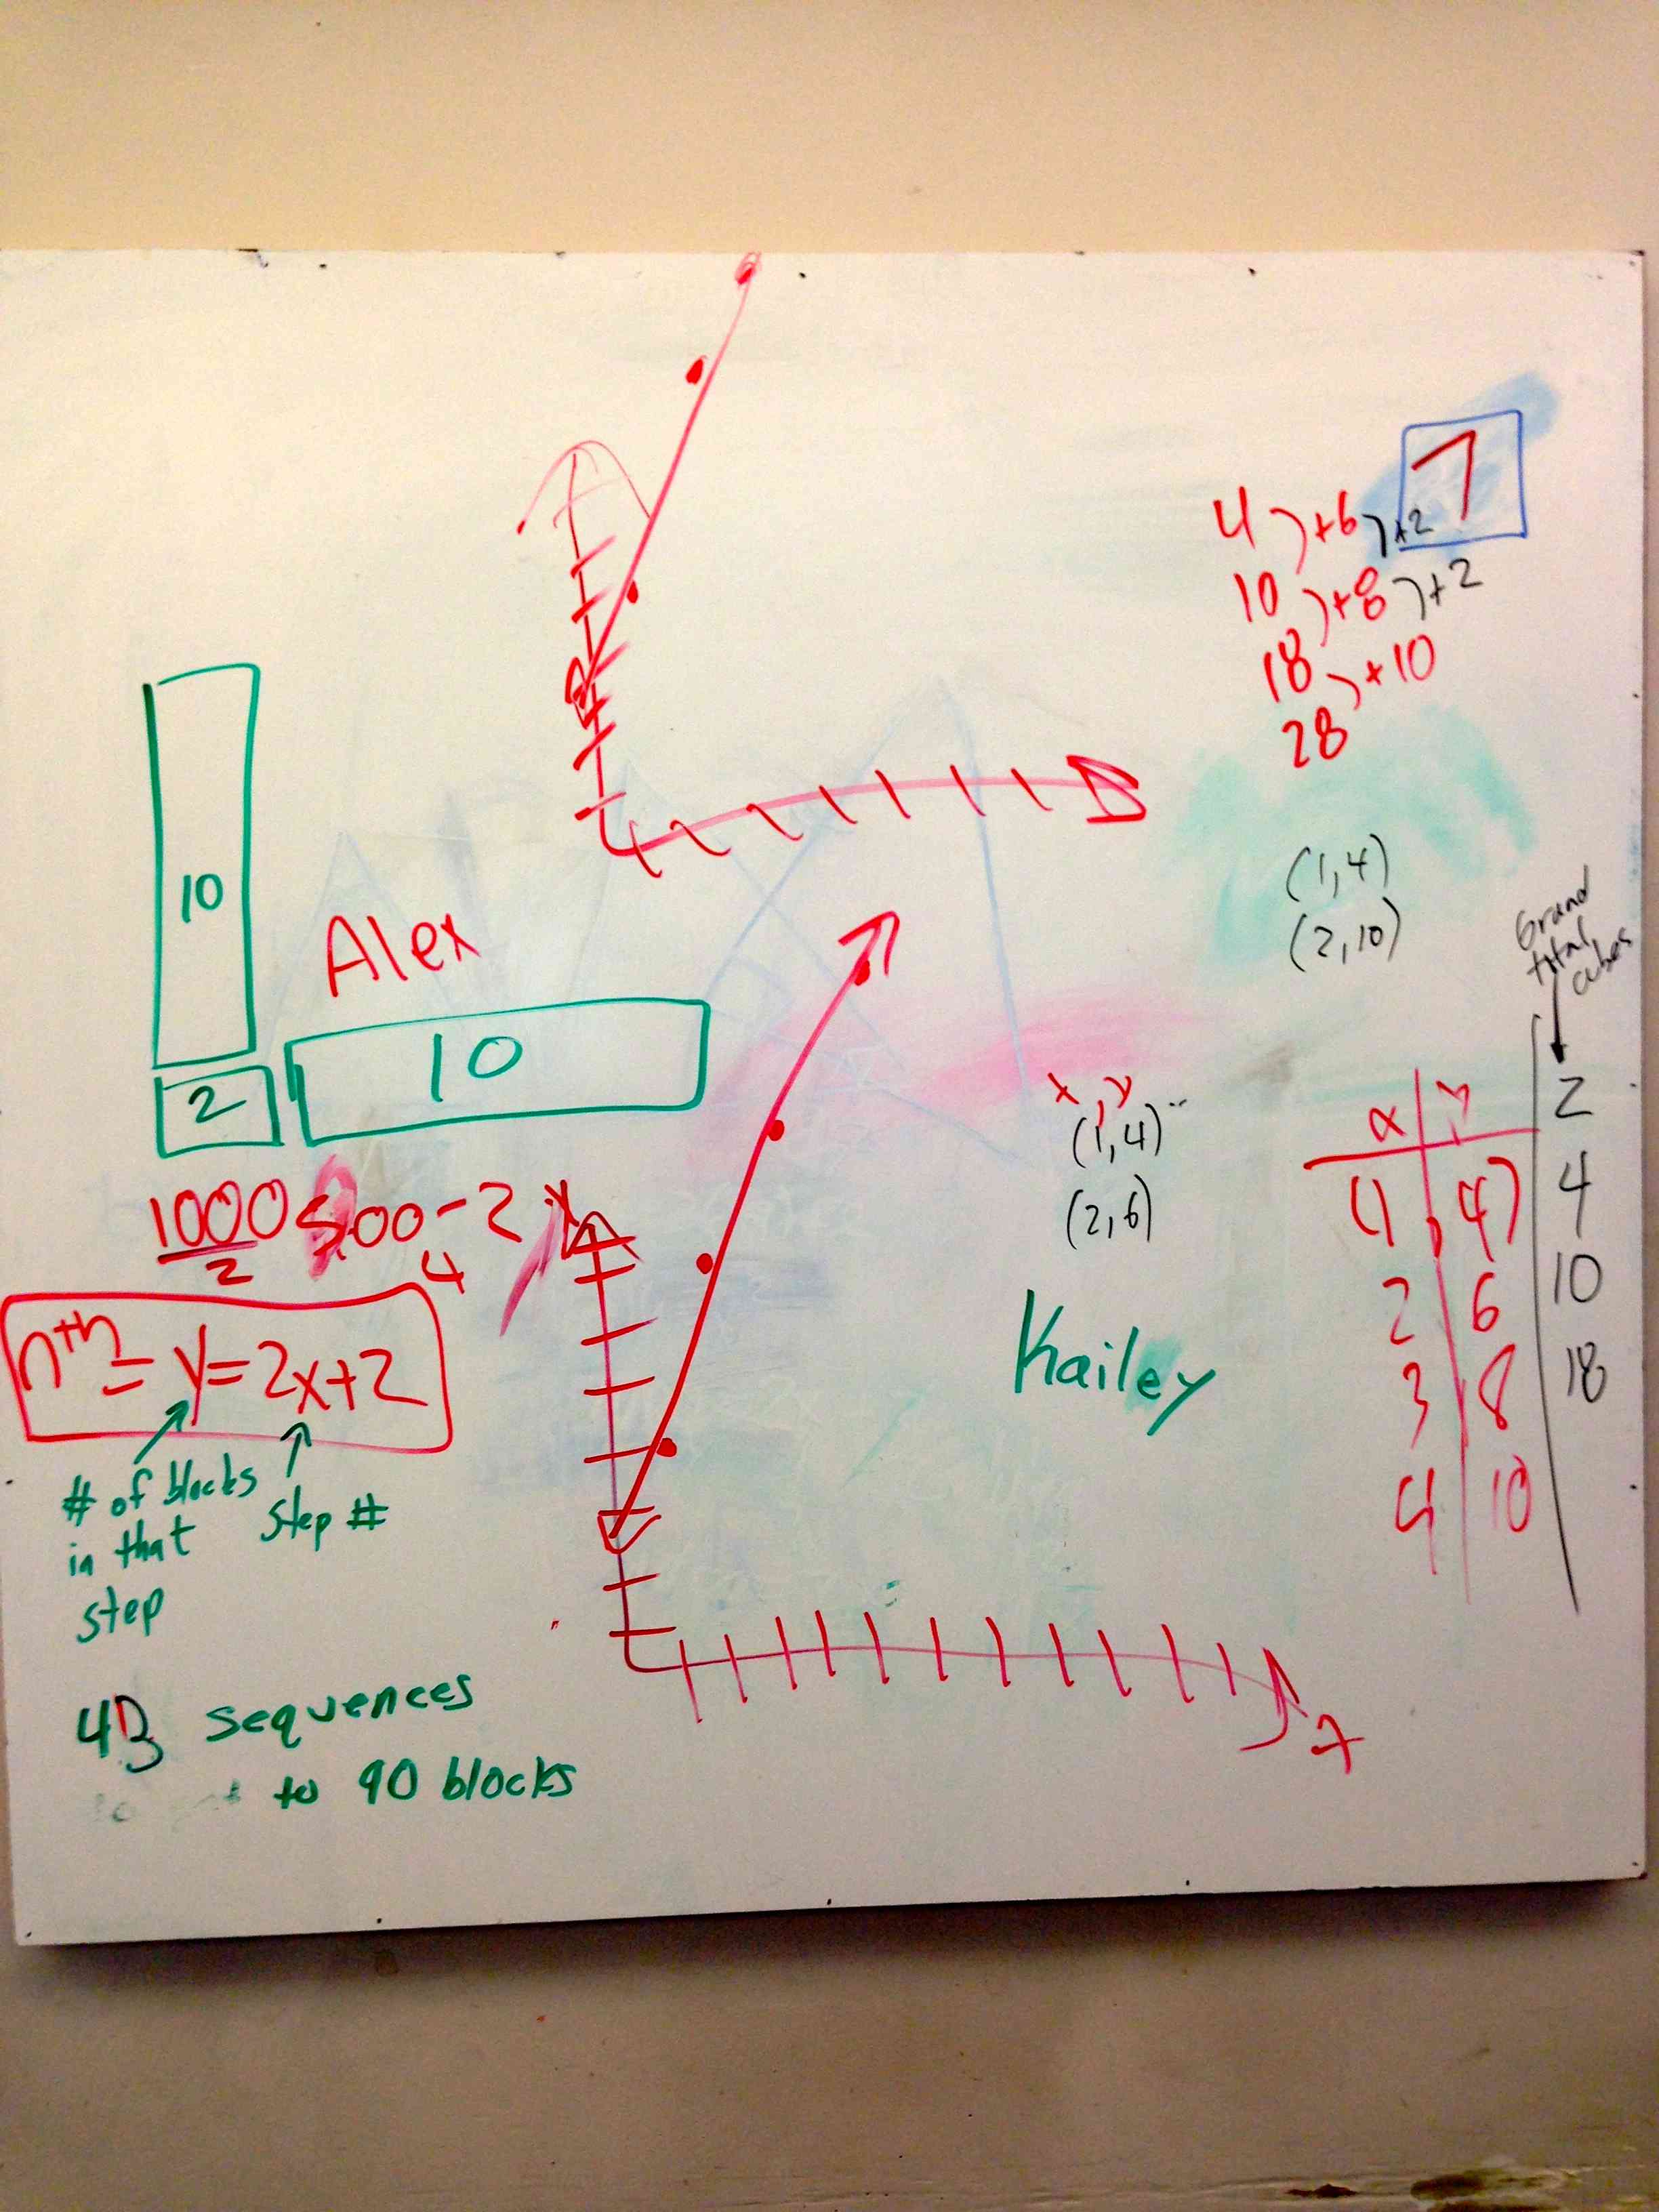
On the whiteboards below you will see graphs because in this particular case I also asked them to graph the number of blocks per step, and the total number of blocks needed to build the entire sequence per step. I wanted them to have to graph something non-linear.  I think it helps further highlight what makes things linear when they work with things that aren’t.

They don’t go directly to the whiteboards.  I first give them about 5 minutes to develop their own thoughts in quiet.  Then I group them and they do their thing.

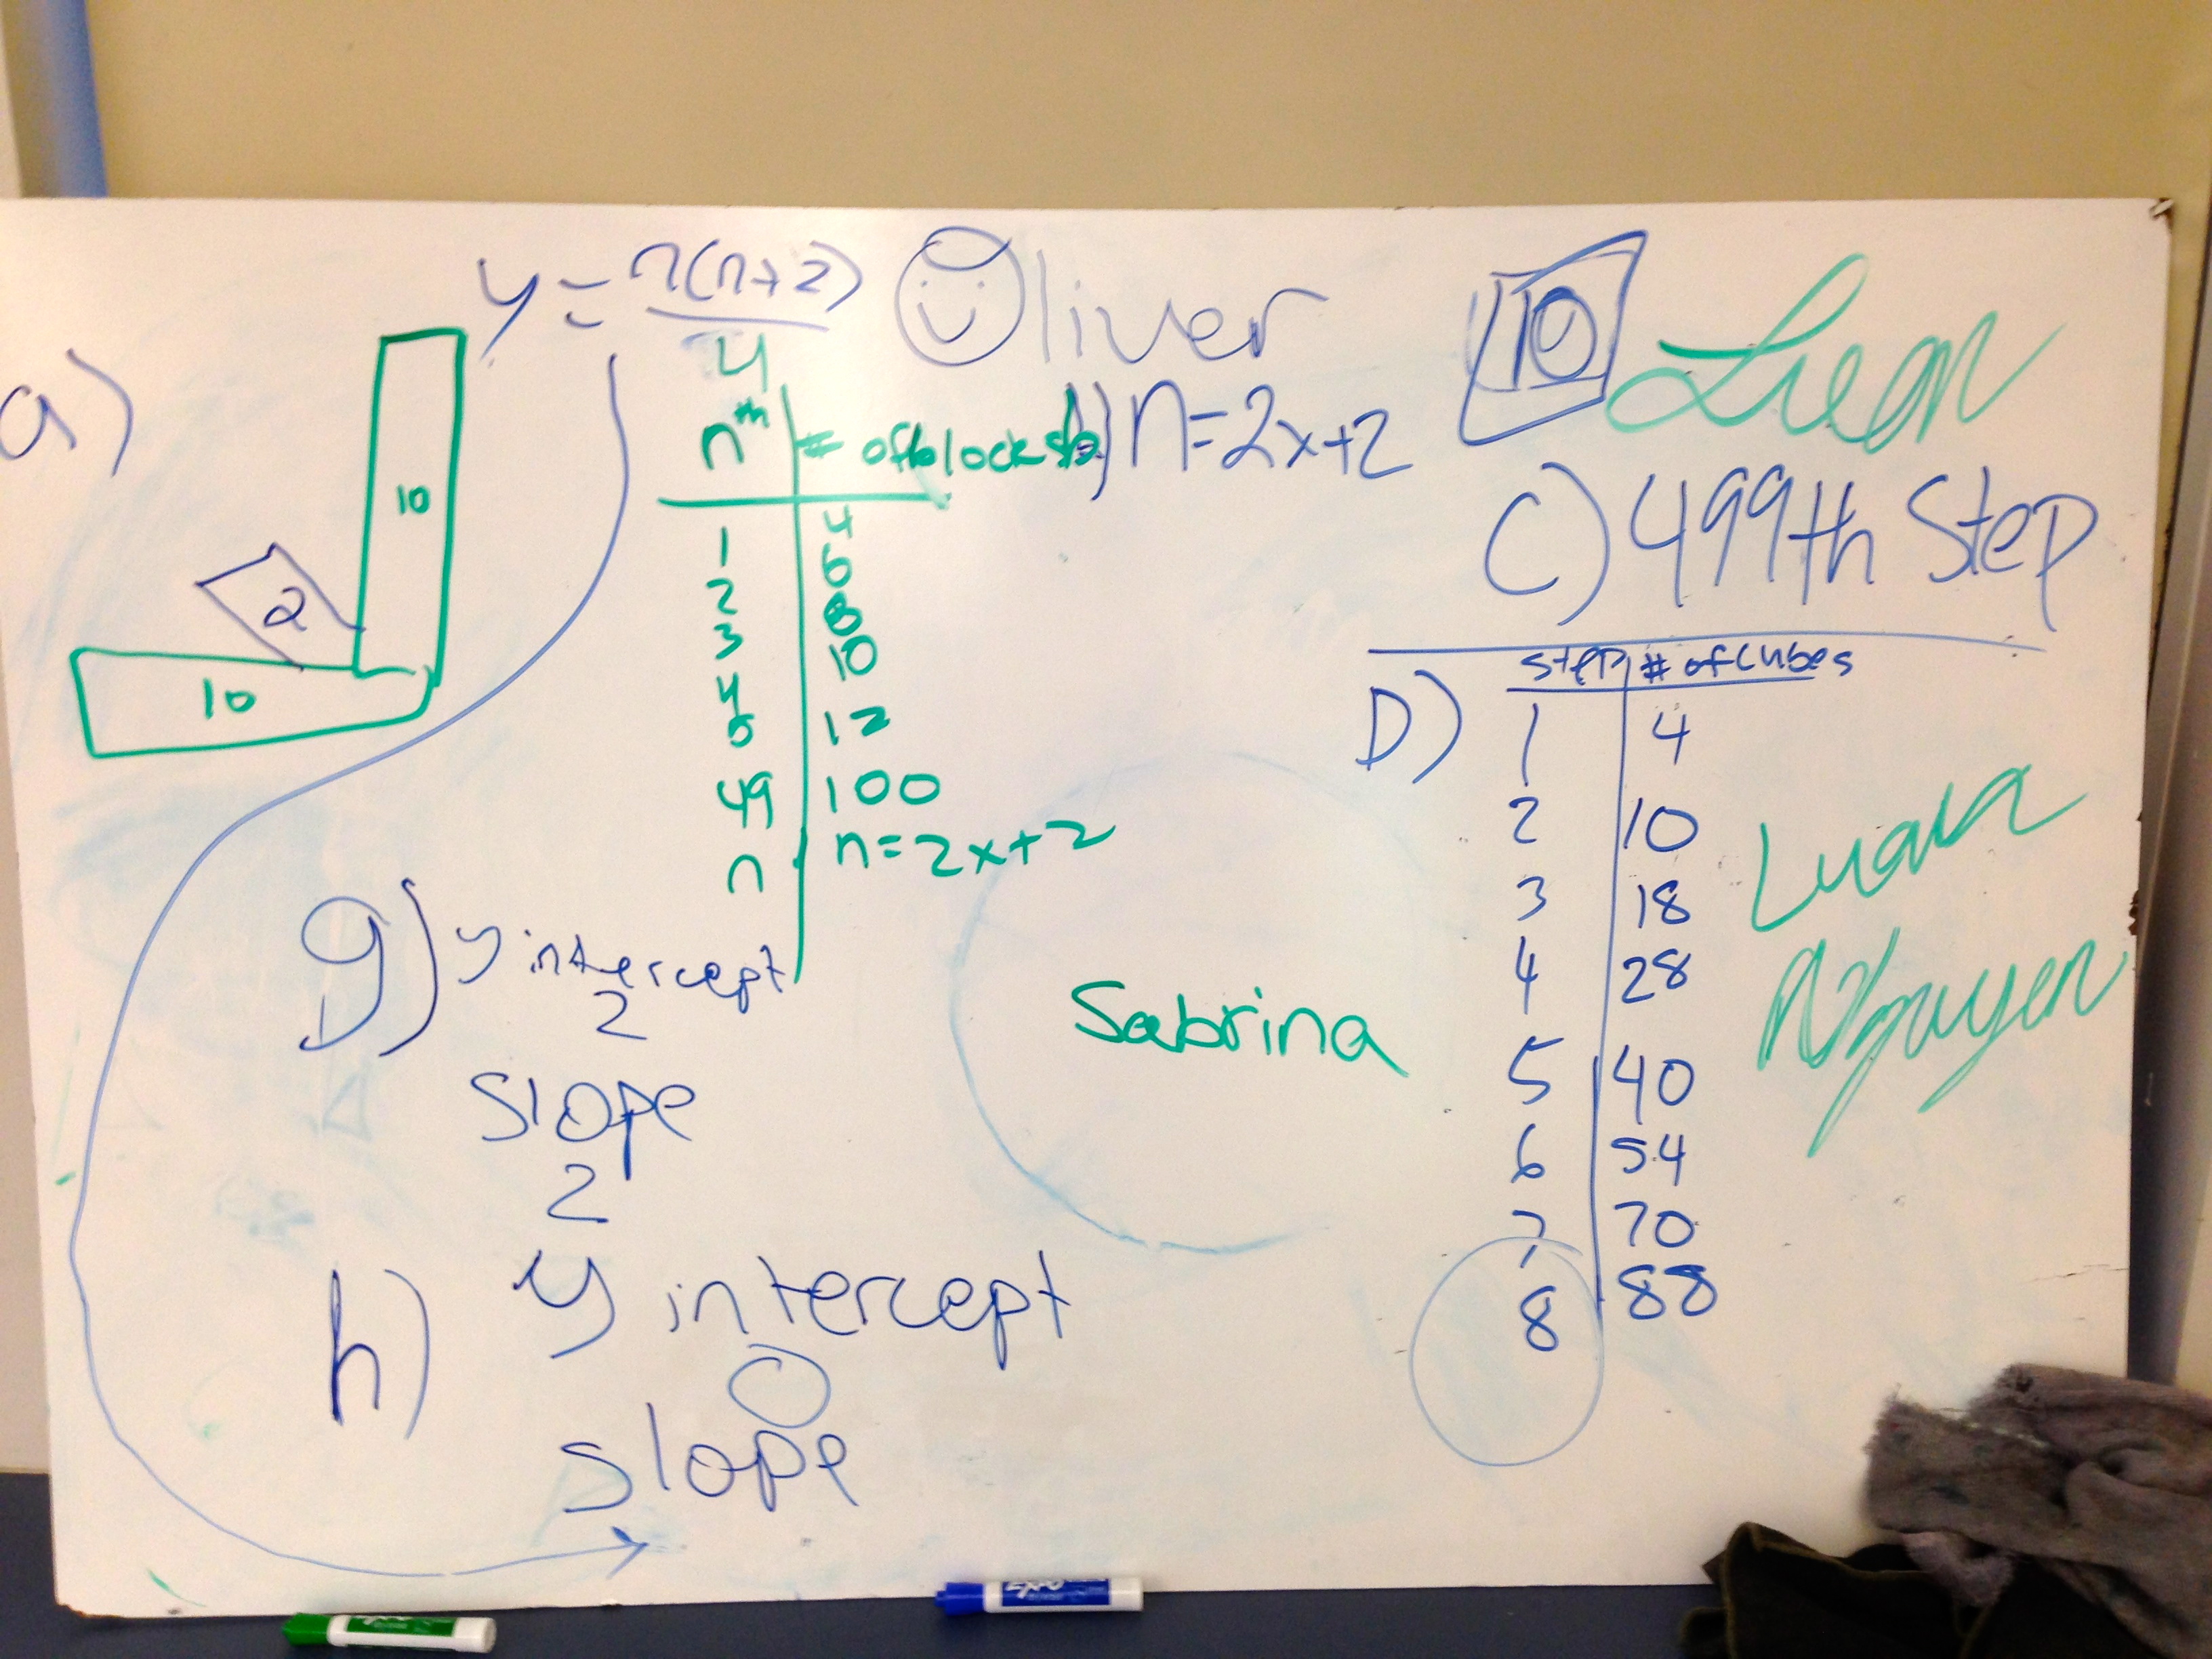
After class I always look at every whiteboard and judge how much of the conclusions are in their writing vs my writing.  I’m not sure what I gain from that but it is a research point for me right now.  There is a little bit of my writing on boards 7 and 5, but they are supplementary thoughts and not the main thinking that I wanted to the students to do.  Here are some of the whiteboards after the activity:

IMG_2163

IMG_2164

IMG_2165

IMG_2171

Lastly, after it was finished I had them go back to that paper with their initial thoughts and complete the problem on paper. I give them graph paper and rulers and have them make nice graphs to turn into me.  In some sense, one could think of the paper as the assignment as the whiteboard as a giant scaffolding.  But in another sense the whiteboards could be the assignment, and the paper is something that goes in the notes.  Or in another sense…

This Is Always On My Whiteboard…

…  in geometry, for the first month.

photo (1)

because I can do things like this quickly

photo (2)

And then students get a tone of mileage out of a worksheet like this (thanks Walt!):

DrawingConclusions_Page_1

DrawingConclusions_Page_2

And it’s not “always” on my whiteboard, but it’s on there a lot  :0

Right at the beginning of geometry I want to focus on helping students draw conclusions from diagrams and given information.  Plus I have done a lot of programming and have a natural love for the IF THEN statement.

IF this THEN what?  So we got a piece of information – what does it do for us?  What does it tell us?  And since the IF THEN is not on my main whiteboard (my main one is the big one on the right of the picture above), I have no problem leaving up my IF THEN all the time.  And probably most importantly – Having it already on the whiteboard reminds me to use it.

“If angles a and b are complementary THEN a + b = 90”  I am reinforcing the point that all we know is that the two angles add up to 90.  We don’t know where the angles are located, we don’t know if they are adjacent, we don’t even know how big they are, or what color they are…  we just know that they add up to 90 degrees.

Here’s the worksheet above as a pdf:

DrawingConclusions

Learning To Teach The Great Lessons

You don’t have to write great lessons.  But you do have to teach them.  The best lessons in the world – if delivered by an untrained hand, are sure to fall well short of their potential.

So let’s say you find the perfect 3-Act lesson from Dan Meyer, or real-world application from Mathalicious.  And you are stoked.  Now what?  Well, filling this out is a start I am implementing this year:

3ActOrganizer

I recommend not leaving any of this to chance.  Your natural teaching skills will have plenty of time to shine during the lesson – but I recommend formally addressing (which to me means write it down) the following important aspects of allowing a great lesson to reach its potential:

1. Focus Question:
What is the main question(s)  the lesson meant to address.  This just focuses you.

2. Reason(s) I Think This Assignment Is Great
Remind yourself why you choose this particular assignment out of the great sea of possibilities.  What makes this lesson so great?  And as a bonus, you should start to see a pattern as to what you value in a lesson.

3.  What I Want Them To Learn
Write the skill, or standard, or whatever it is you want students to take away from this lesson. Again – it is important to formally confront it here so you make sure it happens.

4. How I Am Going To Set It Up
What’s the hook? What’s the scaffold? How is the question going to be formulated?  Give this the time it needs because if you mess this up it’s hard to recover.

5. How I Will Help Students Who Don’t Know Where To Begin
I started prepping myself for this a couple years ago and it pays off big time.  Have your response down so you can give the student the right hint and then move on. Maybe have a visual print out ready to go.

6. These Are The Most Likely Mistakes
List them out and also talk about how you will address them.

7. The Extension Question(s)
We have to have somewhere for the top students to get the question to ensure everyone is challenged. Be specific about what the extension is and how you are going to pose it. Be very careful of anything that sounds or feels like busy work.

On the back of the paper I would reflect on the lesson as a whole.  Here are the two I filled out for my 1st day of classes this year:

IMG_2026

Geostationary Satellites in 3 Acts

Need an interesting way to teach circle properties?  Me too!  And as a bonus this lesson also has the Pythagorean Theorem and extension questions that provide some advanced geometry for those students who are hard to challenge.

And don’t get intimated by satellites – just go here and read up.

The Hook (aka: Act 1)

A stunning time-lapse over the Swiss Alps.

[vimeo 61451883 w=500 h=281]

Chalandamarz of geostationary satellites in the nightsky over Diavolezza from Roland Stalder on Vimeo.

See anything interesting?

Spoiler Alert!  Some of the stars are not moving.  Students will pick up on that and it will cause a sense of intrigue.  I’ll bet you a beer that it will.  The reason the stars aren’t moving is because they are in a very special orbit called “geostationary orbit” so they are matching the earths rotation exactly.

Me:  “Any explanation about what these stars that don’t move are?”

Students give some opinions about what is happening here.  Address them and discuss them.  No fear – spend some time googling and you will be able to talk intelligently about that.

Me:  “What else do we notice about these stars that don’t move?”

The key here is that not only do some stars not move, but the ones that don’t move also appear to be in a straight line rather than randomly dispersed about the night sky.    Now let’s make the point a bit more dramatically with another video – this video gives away the answer about what these crazy unmoving stars are in the title:

[vimeo 39536582 w=500 h=281]

Geostationary satellites in the Swiss Alps from Michael Kunze on Vimeo.

The goal of this intro is to pull the students in and get them interested in this amazing, kind of creepy fact, that some of those stars in the night sky are actually satellites looking down on us.  Now I get into the slide show and talk about satellites.  I can give you that if you want.

Take a look at this cool image of the earth as a beehive of satellites.  That outer ring is geostationary orbit.  It’s literally a ring that is 22,336 mi above the earth.  Safe to say retail space up there is limited and in high demand.

312941main_Bee-Hive-1_H1_full

Oh what the hell – let’s just crack up our speakers and really draw the students in by showing them the launch of a geostationary satellite.

OK, table set.  Here’s the two questions we’re serving up:

1.  What percentage of the earth can a single satallite cover?

2.  How many satellites are needed to cover the entire earth?  By the way – a system of satellites is called a satellite constellation.

I’m also going to have them make a scale drawing of their satellite constellation and write a generate equation for the amount of earth a satellite can cover based on it’s height h above ground.

The Data: (aka: Act 2)

I made a handout which a bunch of satellite information on it that I gives students.  It has more than they need, so it forces them to filter out the unhelpful things.

geostationary orbit – 22,336 mi

earth’s diameter – 7920 mi

Screen shot 2014-07-29 at 4.12.21 PM
This Diagram Is From American Academy of Arts & Sciences

Perhaps more specifically here – we are figuring out how many communication satellites in geostationary orbit we will need to provide communications to the entire earth.   The complication here is that communication satellites are line of sight with each other, and with people on earth.  Meaning you have to be able to see the satellites to use them – and they need to be able to see each other to transfer the signal.

The Answer:  Act 3

The math says 3.

Screen shot 2014-07-29 at 4.56.56 PM

Thanks for the nice image Purdue

But Lockheed actually uses 6!  Don’t take my word for it – check the last paragraph here from spacedaily.com:

SpaceNews

So why do they send 6 satellites when they only need 3?  Great question!  The 4th satellite is needed for “full capacity” because due to the earths shape (stupid non-perfect sphere) there a small portion of it that needs the 4th, but 3 covers most of the earth. The 5th and 6th are to “add capacity”, which is engineering speak for increasing the amount of computing power the satellite constellation is capable of providing.

Screen shot 2014-07-29 at 4.13.12 PM

 The Extensions:

This problem can be pretty much get as difficult as you want it to be.  Here are some ideas:

1.  Line of sight is actually not sufficient to ensure communication with satellites.  The elevation angle from the observer to the satellite must also be greater than 10 degrees.  How many satellites will we need to cover the earth given this restriction?  For more detailed information on this question, go to page 19 of this document from the American Academy of Sciences.

Screen shot 2014-07-29 at 4.10.39 PM

Screen shot 2014-07-29 at 4.38.34 PM

These Diagrams Are From American Academy of Arts & Sciences

2.  Can the constellation ever cover 100% of the earth?

Umm, nope.  Geostationary satellites have to be located somewhere in a ring directly above the equator.  If students derive the general formula for the amount of coverage for a given height it will look like this:  

Screen shot 2014-07-29 at 4.46.27 PM

No matter how big h gets, cosine will tend to 1, but it will never be exactly 1 and thus we can never hit 100%.  The north pole can never be reached by a satellite in geo orbit.

3 . What is the worst case communication delay between someone on one side of the earth and someone on the other side?

4.  Write a general expression for the percentage of the earth that a satellite can cover based on it’s height.

The Goods 

Here is the worksheet I used – I don’t necessary like how it’s formatted, but here it is:

GeostationarySatellites

GeoSat2 GeoSat3 GeoSat4


My First Class

I remember the very first time I stood up in front of a room of teenagers and asked them to do something.  I nervously gave them a scattered lecture on the intricacies of y = mx + b.  As I was talking they were writing down the things I was saying, and whatever I put on the whiteboard they also put into their notebook.  During the lecture I even asked the students some questions, and a few of them even raised their hands and offer up answers.  Next I told them to get out their workbooks and there was a huge rustling of paper as they actually did it.  I told them to go to section 5-4 and do problems #1 – 20 or something like that, don’t remember the exact numbers.  Either way, in unison the class asked me “which page number is that?”, I mean it was probably only two students but it felt like they were all asking.  I learned students prefer page numbers to section numbers.

At that point it was about answering individual questions.  So I basically just floated up and down the rows, or at least it seemed like I floated because I don’t remember hearing my footsteps.  Or maybe I just ignored them because the sounds in the room were really beautiful – I was hearing words I wasn’t used to hearing teenagers say, like “slope” and “intercept”.  And I was hearing words more familiar to me like “yesterday” and “that’s cool”.  The students all knew each other because it was the middle of the year.  I was just there for one day as a requirement before beginning a student teaching assignment.  I was a guest in their house.

At the end of the period they all turned in their papers to me – full of calculations and circled answers.  And their names were all at the top right even though I never asked them to do that.  Then a bell sounded and they all packed up and left.  I looked at their papers, more specifically their names, and thought about how cool it would be if I actually knew who they were.  If I was actually their teacher.

I was amazed at the whole experience.  And I’m not saying it was the ideal class, nor am I advocating for any particular teaching strategy – I’m just saying I was amazed.

Monomial Partners

“What’s your name, what’s your monomial?”

This is a great activity that was inspired by Matt Vaudrey’s Equation Speed Dating.  In this lesson each student gets to create their own monomial – which I constrained to having to be even and with a variable.  Then they break up their paper into three columns:  Partner / Our Binomial / Our Rectangle.  The students pick a partner and join each others monomials together to create “Our Binomial”.  Then they factor their binomial and represent it as a rectangle by labeling it’s dimensions and indicating the area.  I circulate the room and once it appears every group is finished, I have everyone get up and find a new partner.  I’m demanding here that all students get up out of their seats and move somewhere new.

IMG_1868

After a couple rounds I started having them draw their monomial and their partners monomial as separate rectangles, and then draw them together.

I have been focusing on a geometric approach to factoring, so the rectangle column was a great addition to previous times when I have done this activity but only asked for the solution.

The column “Our Binomial” does a nice job reinforcing that a binomial is the combination of two monomials.

The Advice

Don’t require them to say “what’s your monomial?”, “do you agree that our binomials is….  “, but inspire them to say it by modeling it.  A lot of my students were saying it because I was giving them messages that anytime they get the chance to say “monomial” or “binomial” they need to take it.

Tell the students not to move onto a new partner when they are finished.  They need to wait until you tell them to switch partners.

Remind them that you are really counting on the partners to catch any errors! Because you can’t do the problems on the board since every pair is working a different problem.  “And yes, you are the partner I am counting on for someone else.”

“What’s your name, what’s your monomial?”   No that’s not a pickup line for Speed Dating…  or is it?

Explaining “Explain”

Here is a released question from Smarter Balanced (I even answered it!!!):

ExplainingExplain2

Ok I lied.   That was an edited version of a Smarter Balanced question – here’s the original:

ExplainingExplain1Now all of a sudden my answer doesn’t seem sufficient anymore 🙁   Here’s my best guess at a popular student answer:

ExplainingExplain3

This word “explain” is keeping me up at night lately.  In this problem I’m not sure adding the word explain to the end gains us enough to warrant it.  To achieve Common Core we can’t just throw the word “explain” after every problem we did last year and call it a day.  By the way I’m not saying that’s what the Smarter Balanced Consortium did on this particular problem.  But this use of the word “explain” does bring two things to mind:

1.  It’s hard to explain your mathematical reasoning without access to drawing diagrams.

2.  If we ask students to explain something – it should be something worth explaining.

With respect to #1 – my focus this year has been on explanations through multiple representations.  Basically I have students make connections between diagrams, tables, graphs, mathematical symbols, and written descriptions.  I feel underwhelmed asking students to explain with just a typed explanation.  I want explanations to look like this:

SGBridge

In the student work above – image if it was only the conclusion.  Look at how much would be lost.

There are certainly better answers to the rectangle problem from Smarter Balanced than I offered up here.  I actually really like the problem itself, I just do not think having them explain it gains us much versus just solving it.

It’s hard to explain the word explain.  It’s a word that only makes sense to me until I try to explain it.

Tangent Line and Circle Problems

I will categorize this post as “sometimes you just need a worksheet”.  #SYJNAW for my twitter peeps.

I have always kind of disliked teaching the circles unit in geometry because of all the different rules – tangent / secant angles, chord-chord sides, chord-chord angles, blah blah.  This year I put together a learning segment on circles that involved satellites in geostationary orbit.  It was based on my experiences working at Lockheed Martin and my engineering background.  I will write about it when I have time.  But for now I will just attach a couple worksheets I made of problems that I put on a homework, or threw in a test. I figured I would just share these, because you know… some times you just need a worksheet.

These problems themselves involve tangents, central angles, and trig functions.  The actual learning unit is very similar, but requires the students to contextualize and decontextualize.  So without further comment – here’s some of the practice problems I used:

SatelliteGenQ1

SatelliteGenQ2

SatelliteGenQ3

The Goods: (sorry I only have pdf’s, I create things with Adobe Illustrator)

SatelliteGenQ1

SatelliteGenQ2

SatelliteGenQ3

T-Block Visual Pattern

I created this visual pattern as a followup to the I Rule! exercise from MVP.  It is intended to be more difficult than I Rule!.  When I gave this to my students, I included a linear T-Block just like MVP does for I Rule!  

TBlock

I asked them two questions:

1.  How many squares are in the 10th sequence

2.  How many squares are in the nth sequence

Only a couple of my students actually got to the right answer, but the effort was tremendous.  I had students coming to me during lunch and saying they had asked all their friends and they couldn’t figure it out.  Students were telling me they worked with their parents and couldn’t get it.  I had a student (who failed first semester mind you) tell me that her and her two math tutors stayed 45 minutes after their session working on it and couldn’t figure it out.  She had two pages of work.  I have a couple students who get 100% on everything they touch, and they didn’t figure it out.  So yay me!  I challenged them 🙂

Here’s the I Rule! pattern:

IBlockMVP

Check out many more visual patterns at visualpatterns.org – a site created and curated by my conference buddy Fawn Nguyen (@fawnpnguyen)

The Goods:

Here is the worksheet I used, not sure if I will include the linear T next year.

TBlockWithLinear

The Handshake Problem

The Overview:

I had a lot of fun with the Handshake Problem this year, so I figured I would write about it.  My goal was to use less structure (meaning no worksheet – especially one with pre-staged t-tables).

I revealed the question in three parts, each time raising the number of people shaking hands:

– 5 people go to a party and shake every one’s hand once.  How many handshakes are there?

– If everyone in the class shakes everyone else’s hand, how many handshakes would that be?

– If everyone in the school shakes everyone else’s hand, how many handshakes would that be?

Lastly, in a rather last second “I want them to process this more” moment,  I had them create solution guides for it.

The Description:

I began with the following two questions as warmup problems:

1.  5 people go to a party and shake every one’s hand once.  How many handshakes are there?

2.  If a 6th person shows up to the party, how many handshakes will they give?

After the warmup I raised the bar a little bit by increasing the amount of people who shake hands:

“If everyone in the class shakes everyone else’s hand, how many hand shakes would that be?”

The class problem raises the bar a little, but still leaves the door open for the students to add up each individual scenario.  For example, they noticed that the 31st student would shake 30 hands, and the the 30th student in the room would shake 29 hands and so forth.  So the final answer would be 30 + 29 + … + 2 + 1.  No equation needed, no additional math tools needed.  But I still took this moment to show them a new math tool that would have made there job easier – the summation!  I pulled up the Wolfram Alpha Summation calculator and let them know that a math symbol will do all that addition for you.

WolframAlphaSummation

Then I asked them – How many handshakes would there be if everyone in the school shook eachothers hand?  Now they are dealing with a numbers that is far too big for them to simply do the summation on their own.  But luckily they had this new math tool I just gave them.  I kept that summation calculator up on my computer for them to use.  Pattern found – now execute.  And some of them literally ran to my computer to find the new sum.  Now I can ask them whatever the hell I want – If everyone on earth shook each others hand?  The size of the number is irrelevant now!  They got this.

Finding the above pattern was the most popular solution method.  But other students created a t-table and looked for a pattern to model with an equation.  They pretty quickly noticed that the equation that describes this situation had to be quadratic because we’ve looked at quadratic patterns before.  From there they made things fit and discovered the equation:  (x^2-x)/2.  I told the students that they just had to make the numbers fit.  Which was fine for the students who are good at creating equations like that.  They know what they want the function to equal, they know it’s quadratic – go to work.  The rest of the class was not amused.  And that’s when a student walked up to the whiteboard and amazed all of us.

Jose came up to the board and said, “we know that it is quadratic from the t-table.  So let’s assume there are 3 people at the party.  3 squared would be 9 handshakes, which accounts each person shaking the other two peoples hands, and their own hand.”

photo 1

“But they can’t shake their own hands, so we have to get rid of those three handshakes”

photo 2

“Here we are still double counting each handshake.  So then we must divide by 2 in order to only count each handshake once.”

photo 3

Oh my God Oh my God Oh my God!!!  That was soo excellent!  I had never thought about the problem like that!

And with this equation in hand, when I raised the bar to how many handshakes there would be if every student in the school shook hands, they saw how quickly they could answer it by plugging in the school’s population.

I had students just work in their notebooks, but afterwards I had them formalize their work and create a solution guide.  I will probably write about these solutions guides next – but for the time being, here are some nice ones:

Student1

Student2

The Reflection:

I am most excited about the idea of these solution guides.  It was kind of a last minute idea I threw together, but turned out kind of gold for me.  Ended up doing a gallery walk and have great classroom talks about what THEY liked and disliked about each others guides.  I”m looking forward to see the quality of the next round of them!  Bring on the “Guess What I Heard?” problem!!!