Category Archives: Uncategorized

Adding Value – A Starbucks Lesson

This lesson could be better – but it was my first shot at it. I still definitely recommend it because of the great math conversations we had around convenience and adding value. Here’s the driving question I used:

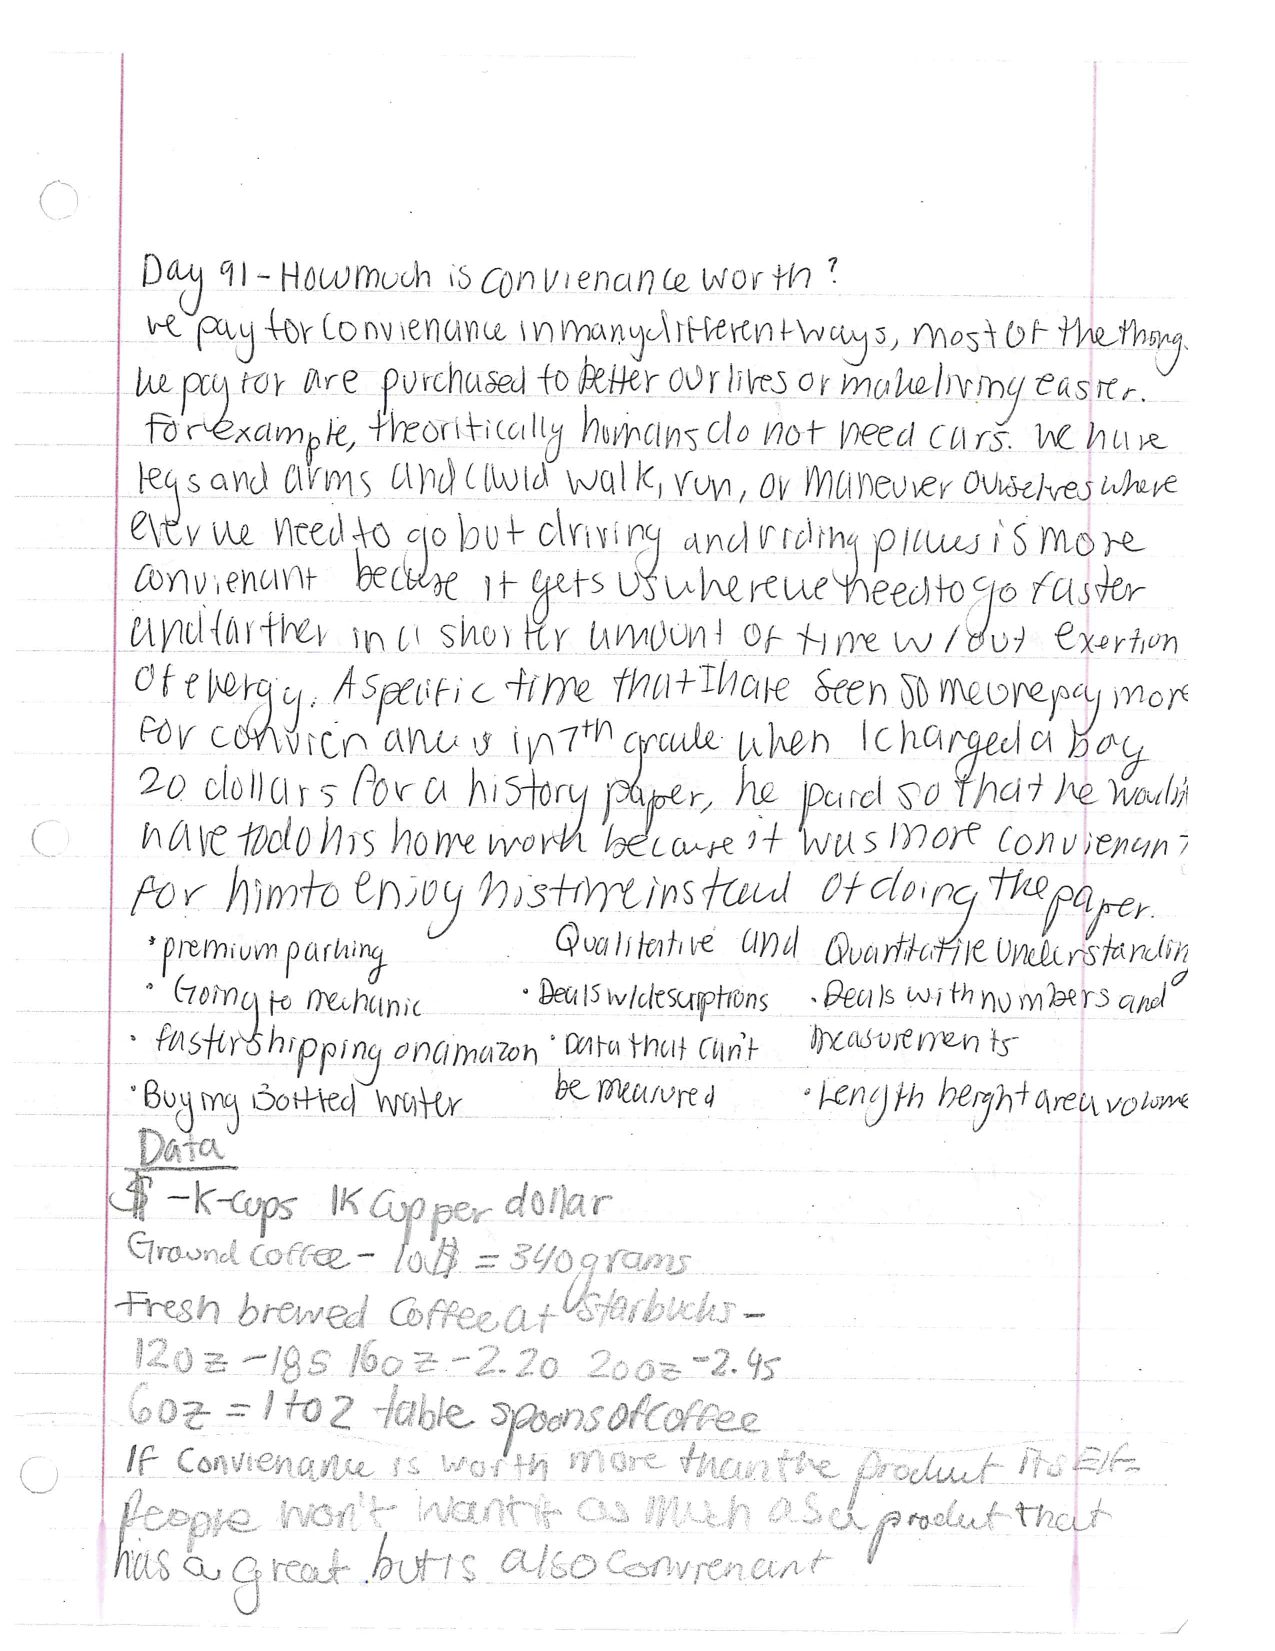
What is Convenience Worth?

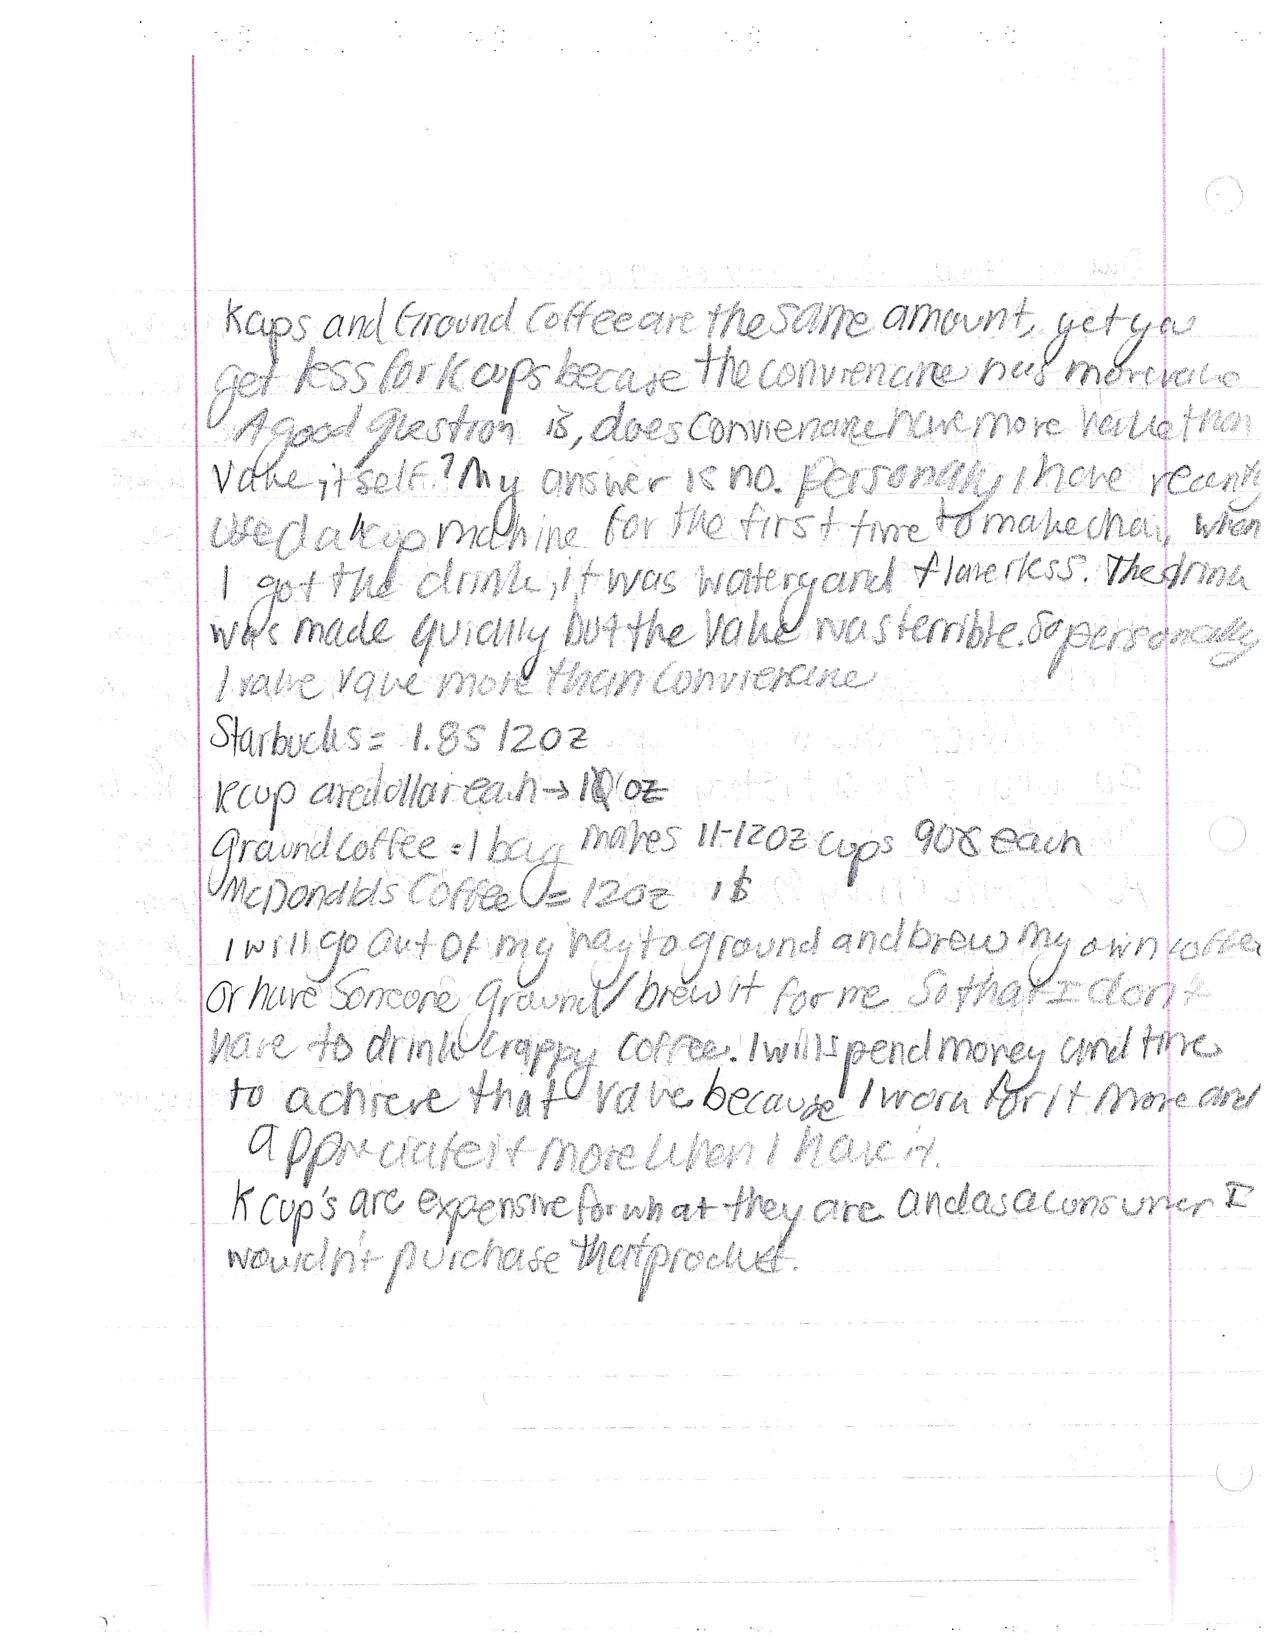
But it didn’t work as well as I wanted it to because we were really only looking at the convenience of the k-cup vs. ground coffee vs. going to a coffee shop.  It’s a cool driving question, but not necessarily the focus of this lesson.  This lesson is based more on “adding value” – where value is defined as what people are willing to pay for.  Starbucks added value to it’s coffee grounds by putting them into K-cups, and that is why they are able to charge more for it.  So how much value did they add?

So here’s the lesson:

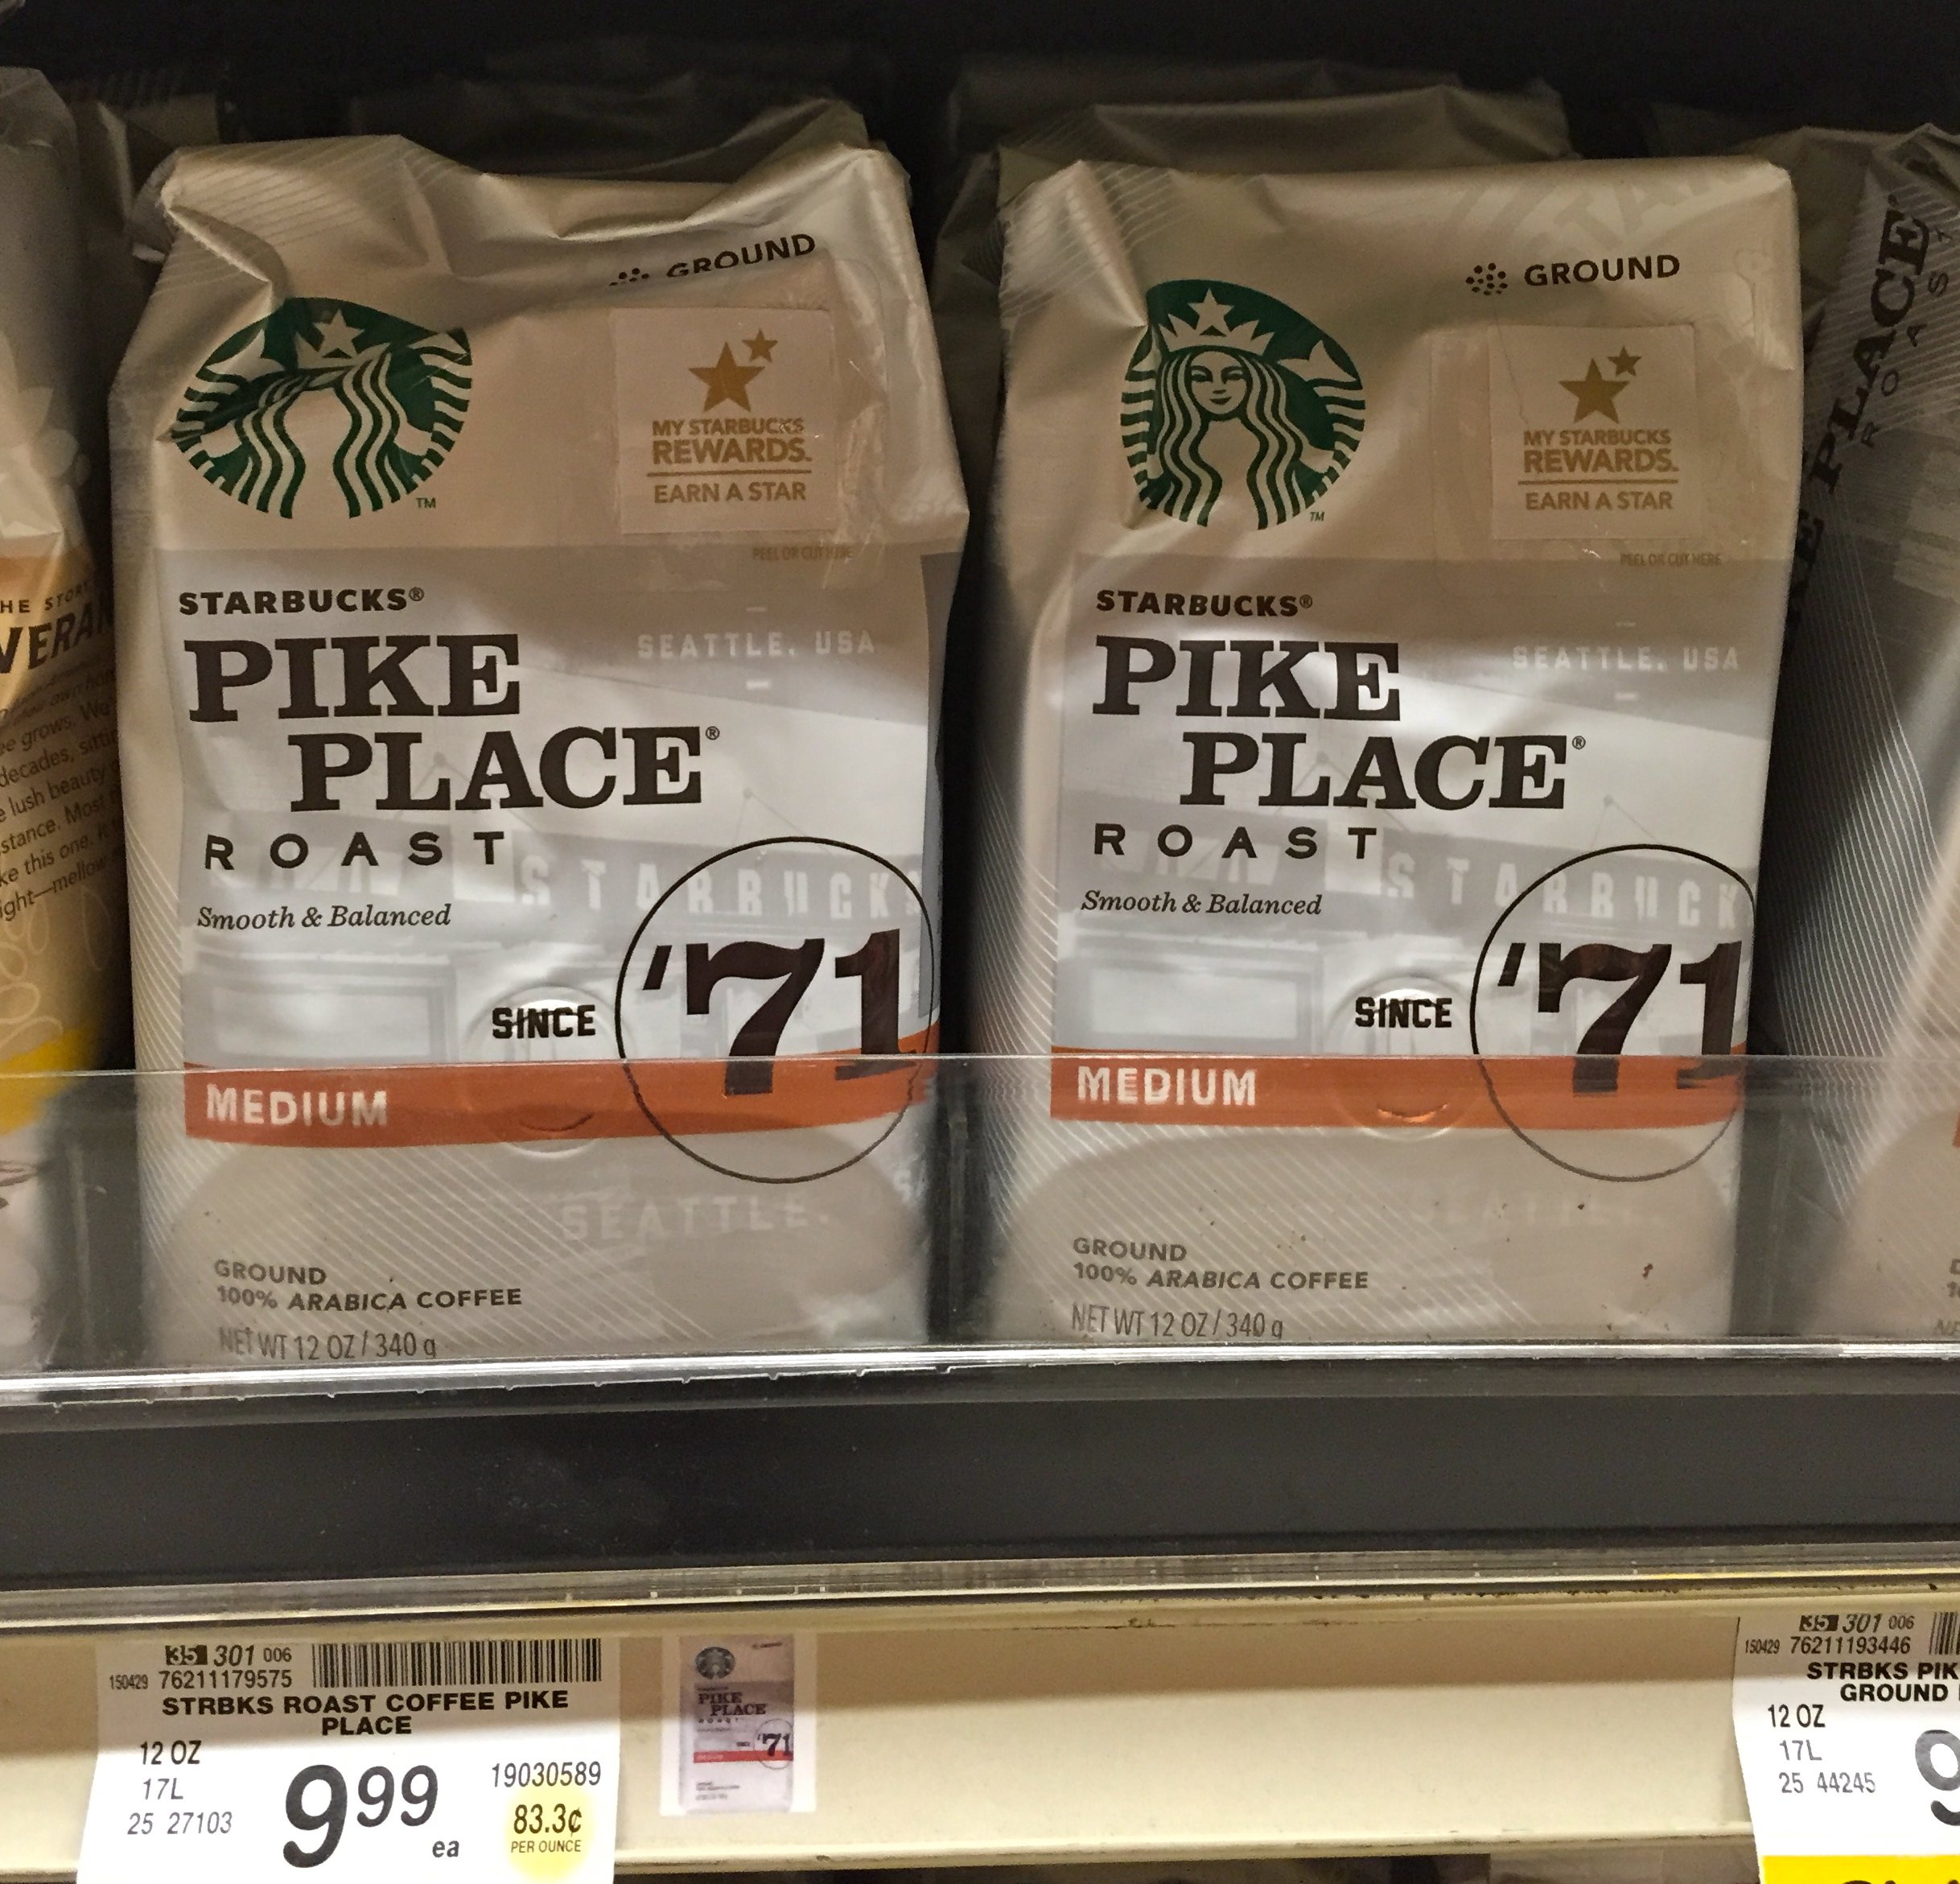
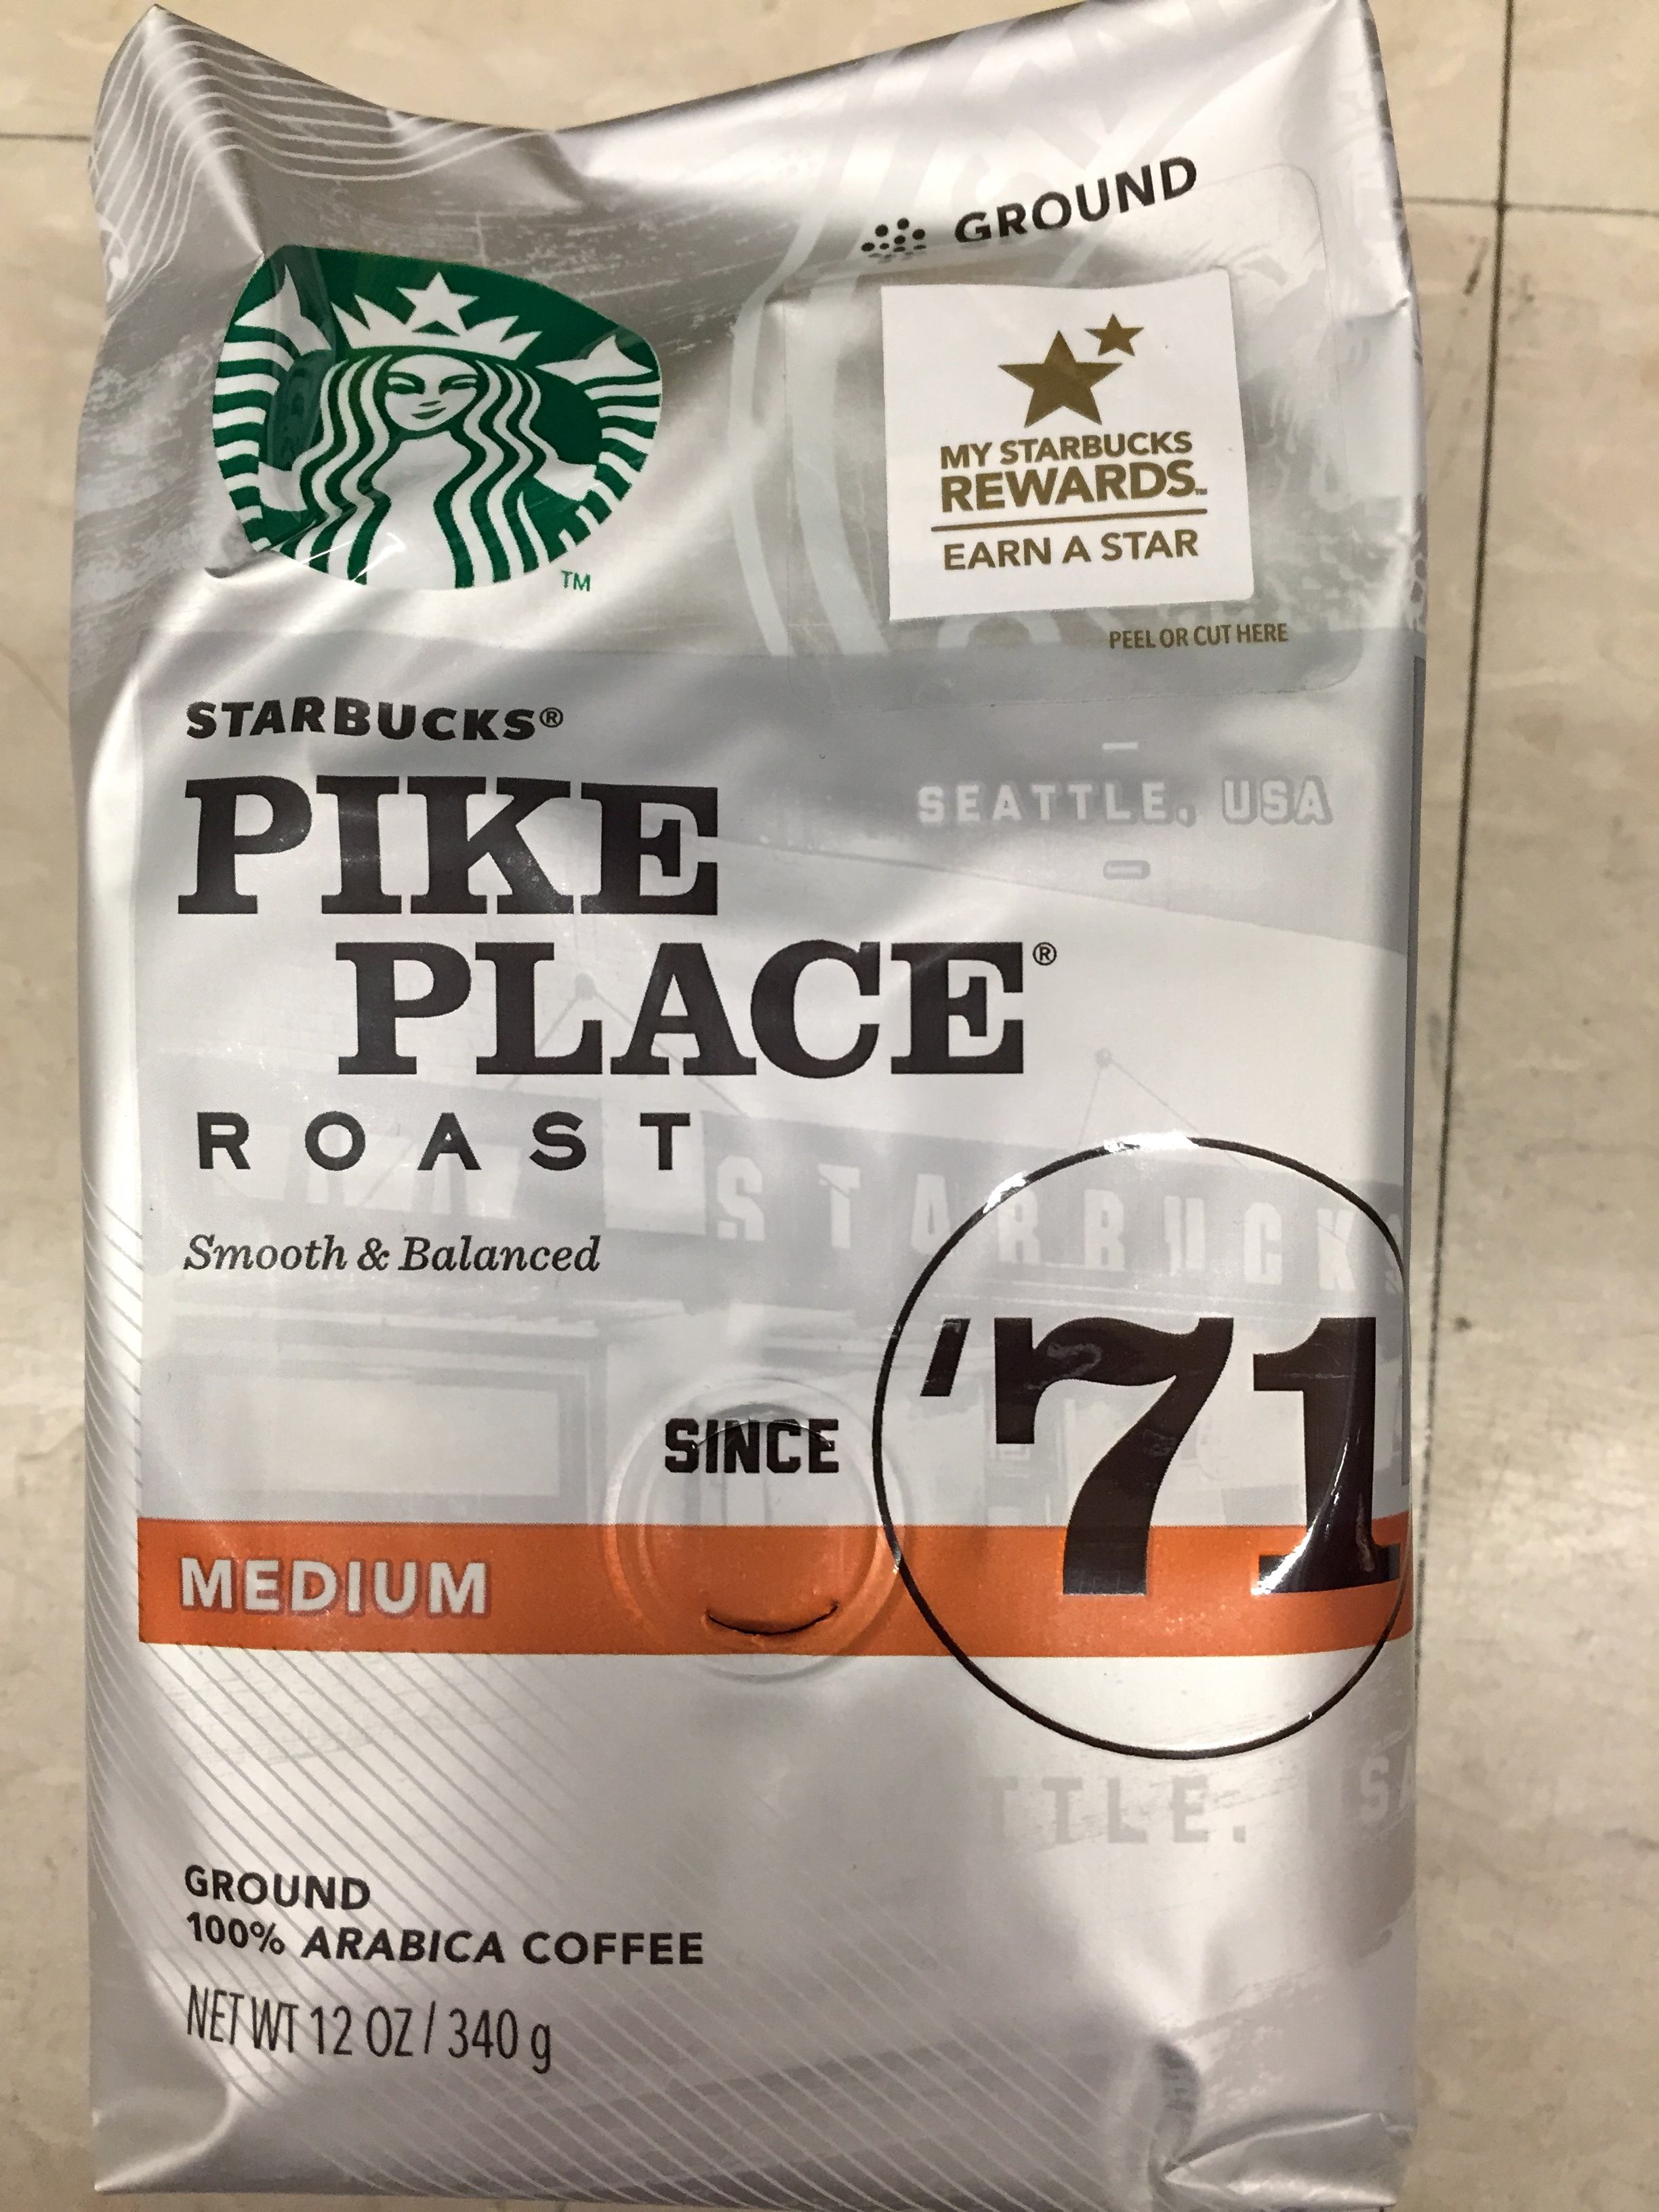
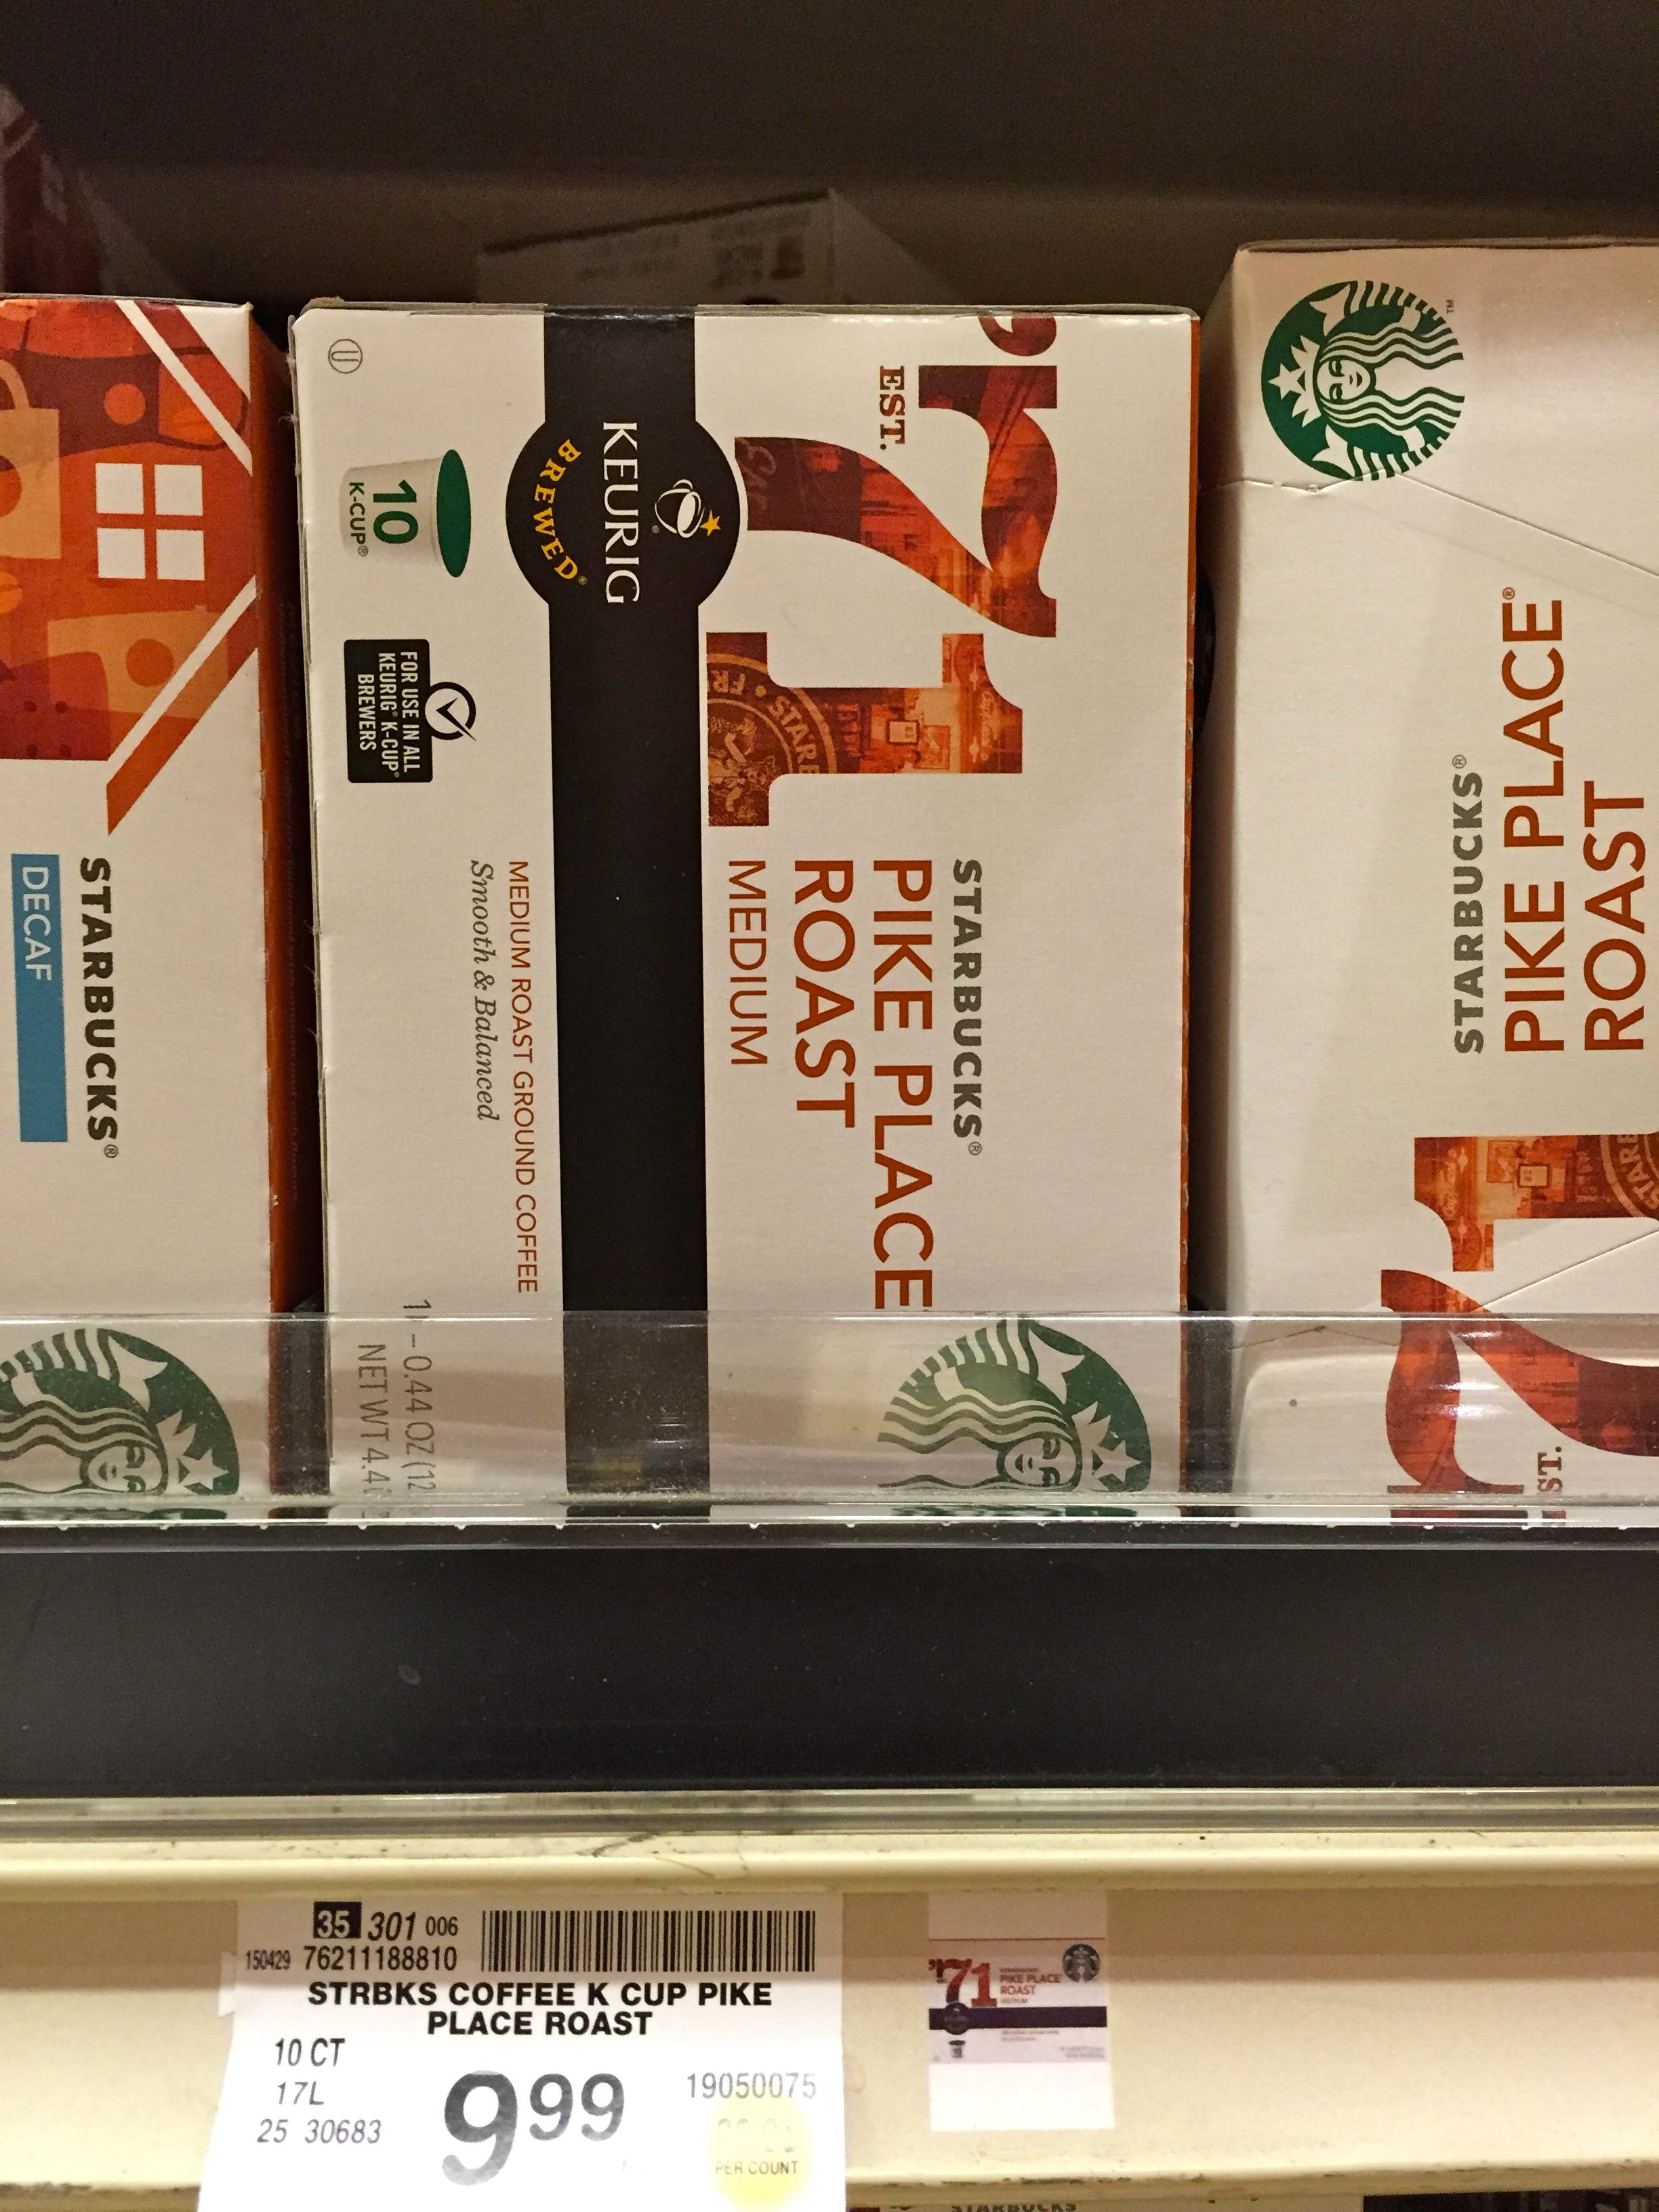
Angle 1:  K-cups vs. Ground Coffee

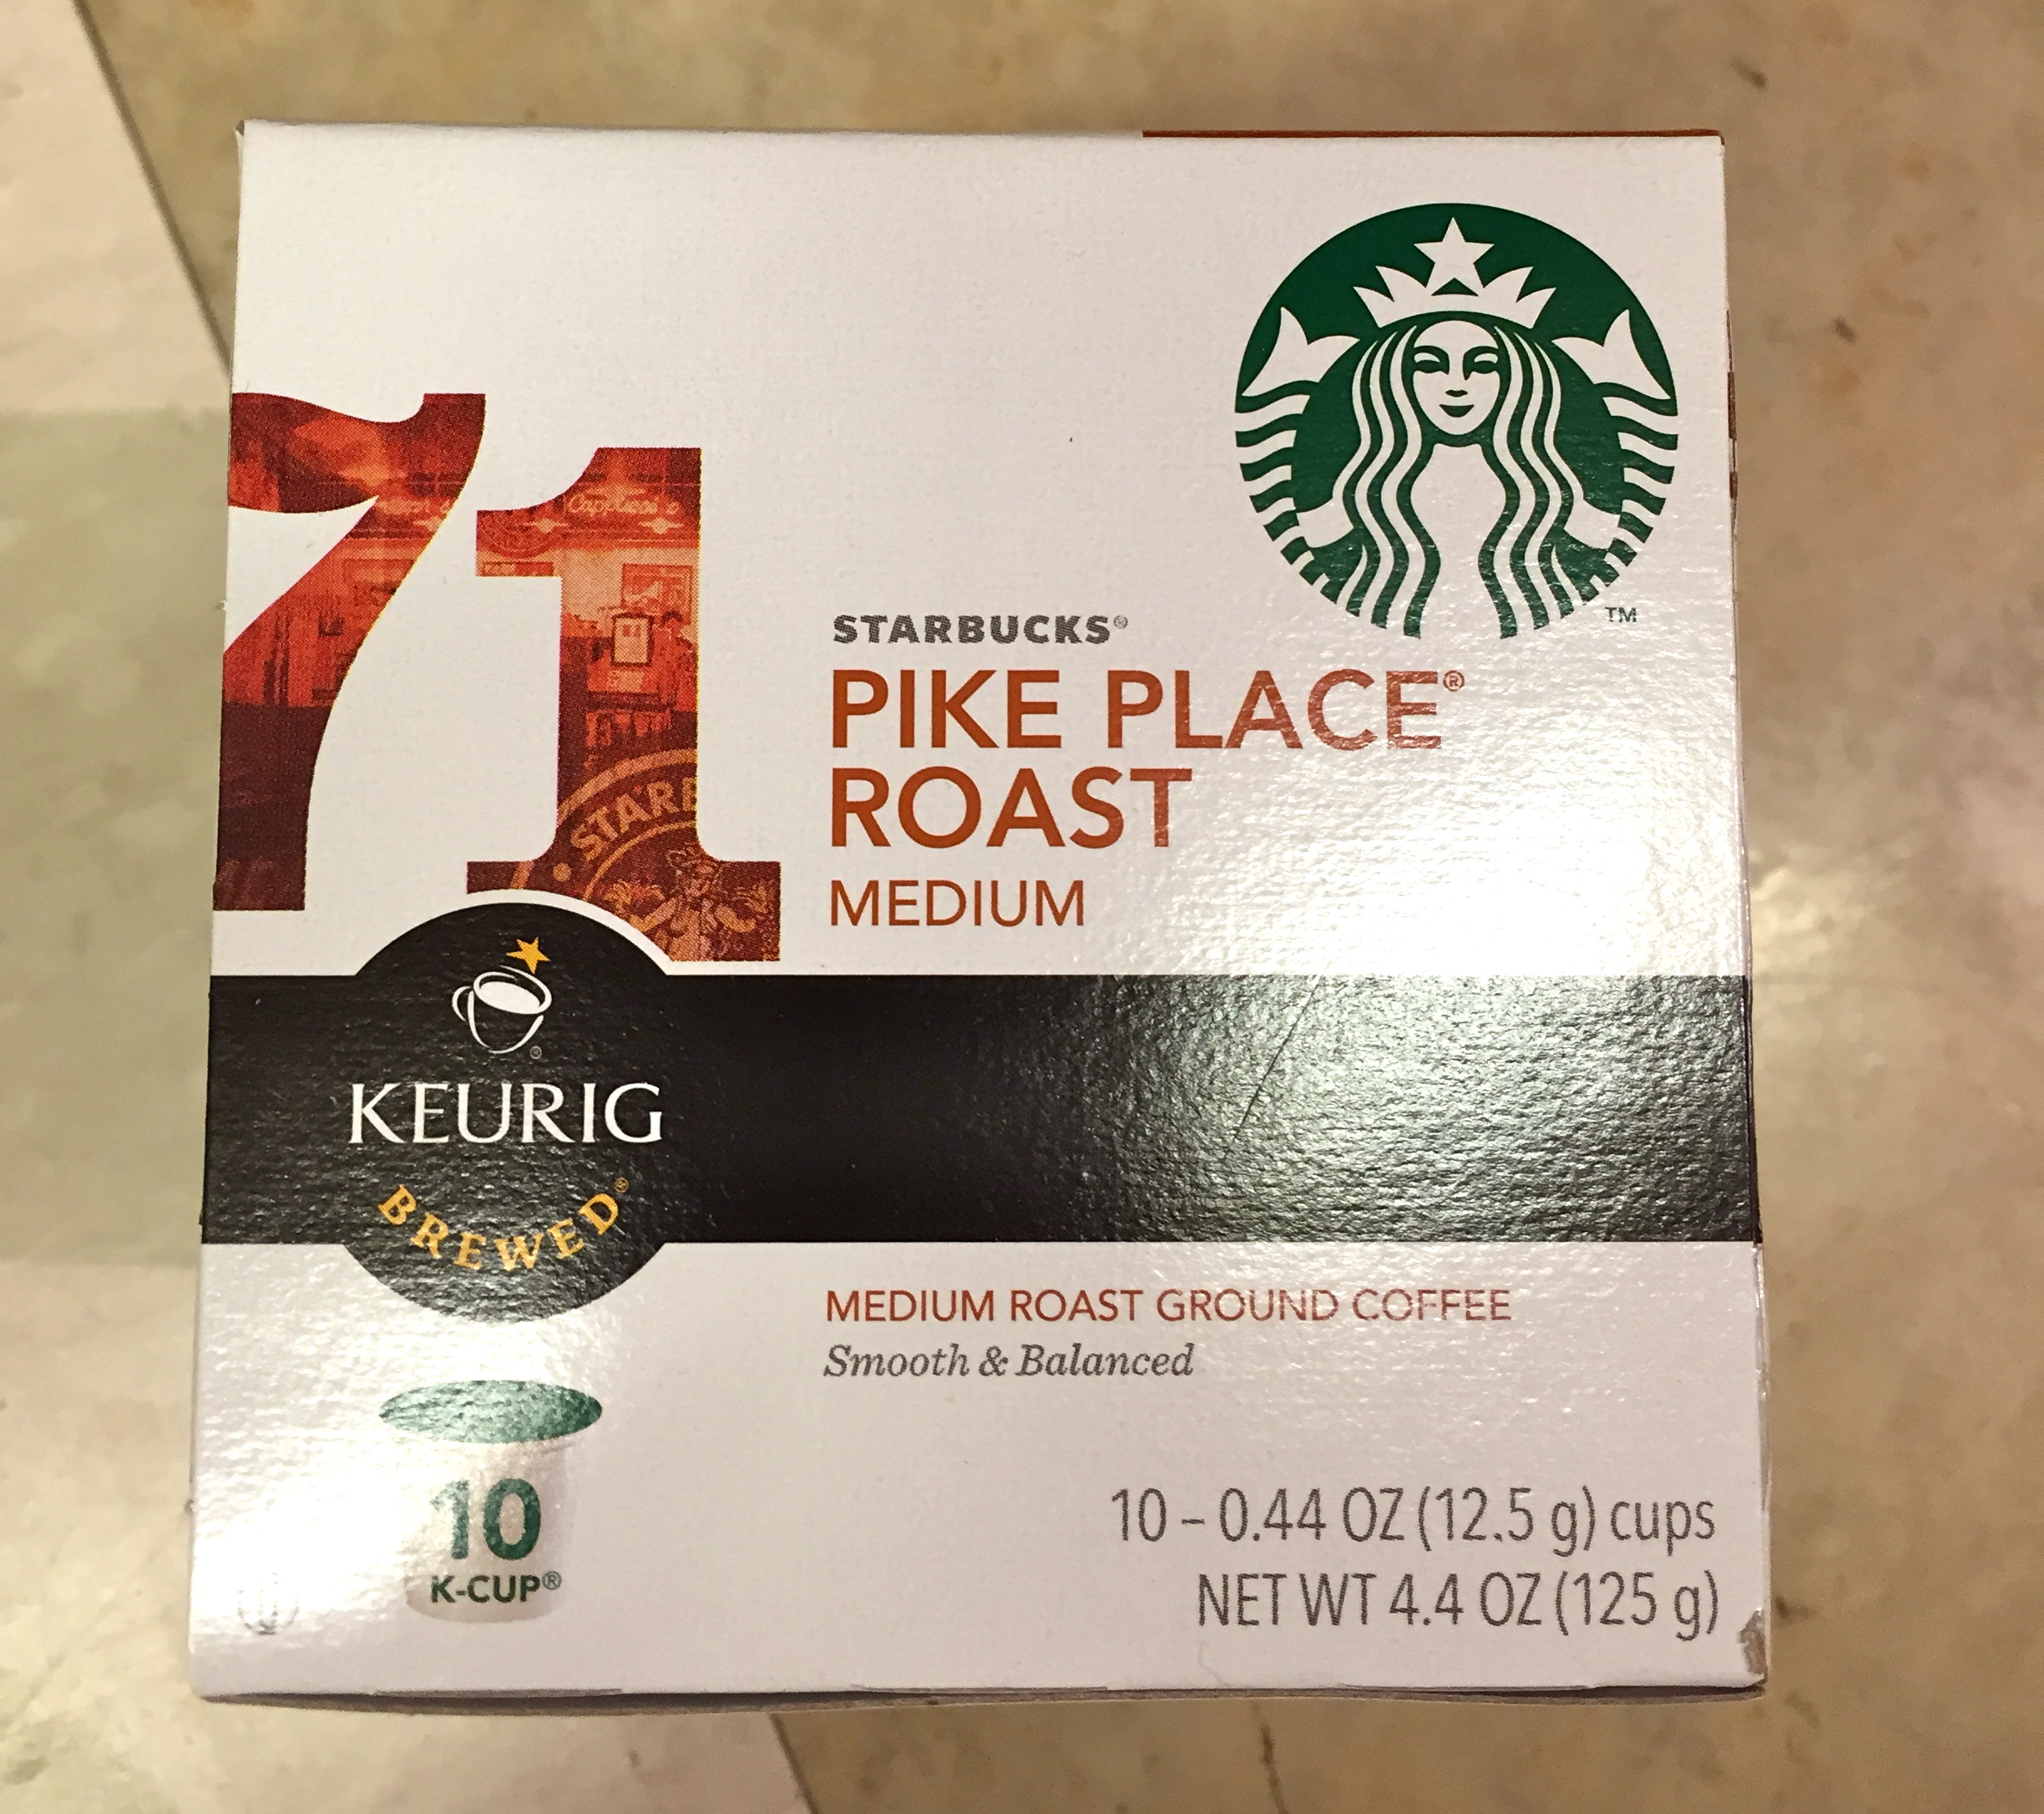
Starbucks makes K-cups and ground coffee, and both sell for $10!  [excellent] So are they the same price?  The K-cups are a package of 10, 12.5 gram cups.  And the ground coffee is in a 340g bag.  Starbucks is able to elevate it’s price for K-cups because they are more convenient than traditional brewing methods.  So what’s the value of that convenience?

IMG_2741

IMG_2742

IMG_2732


IMG_2733

Angle 2:  Coffee Shop vs. Brewing At Home

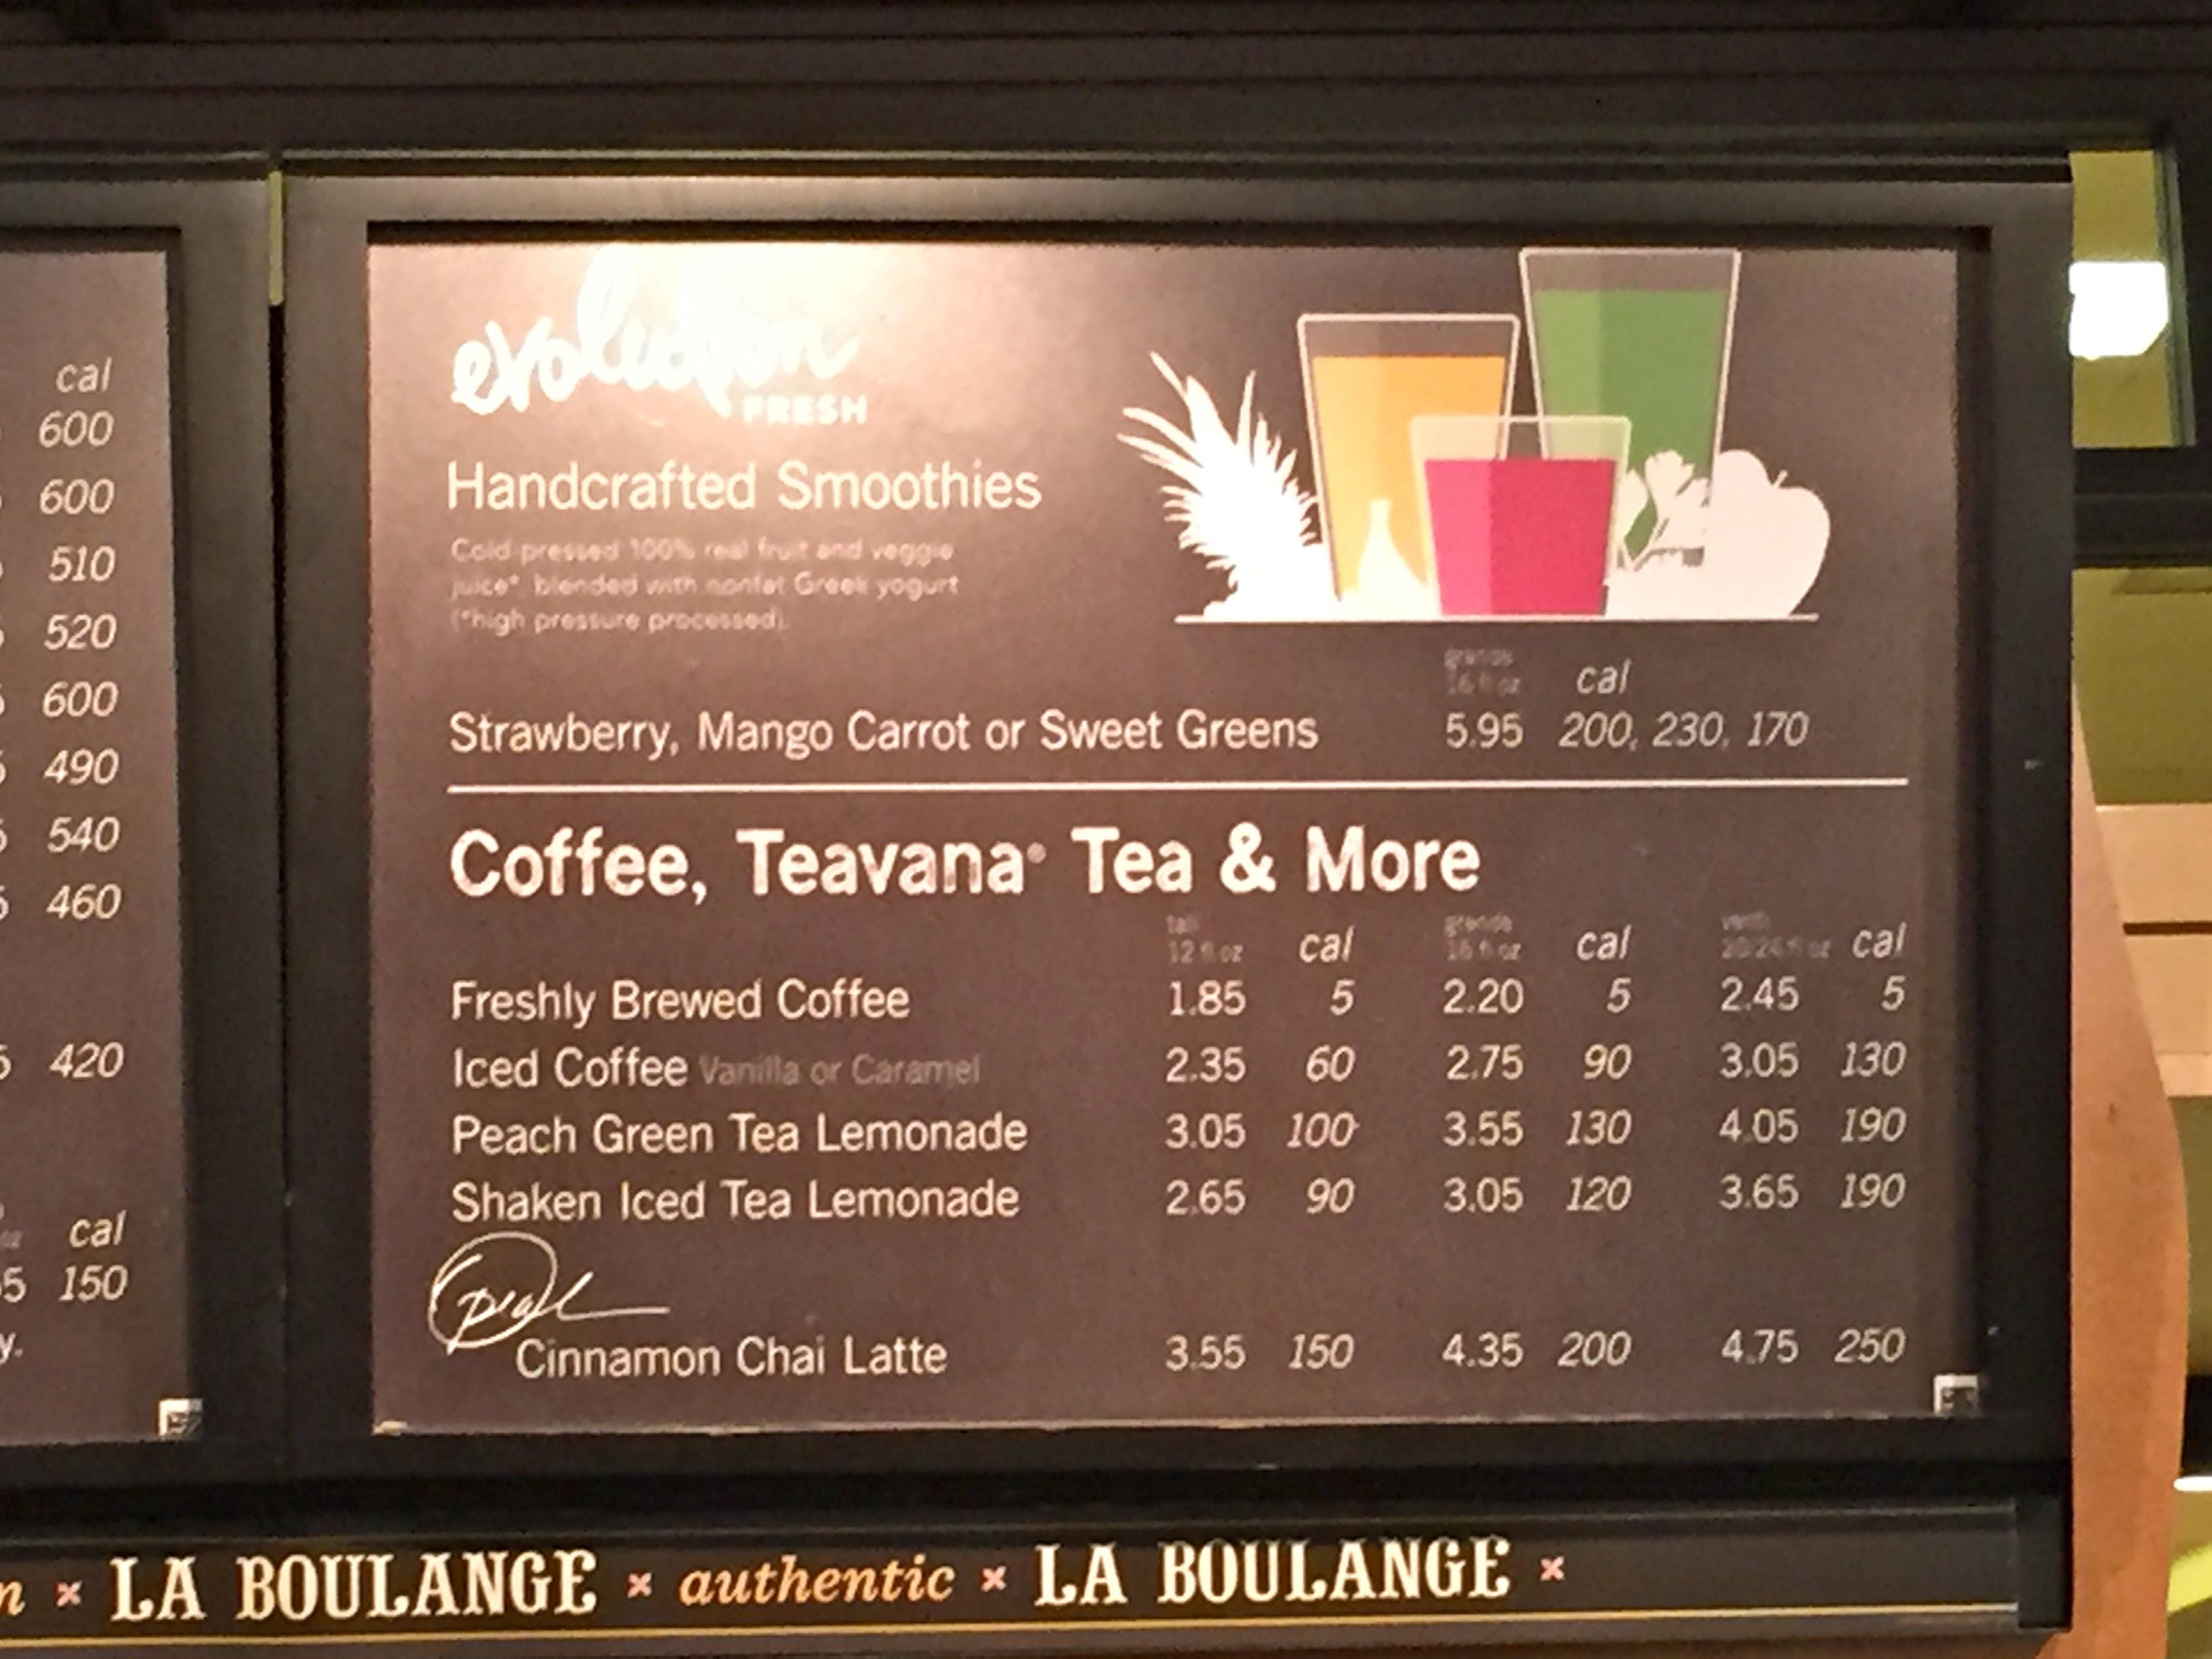
It is more expensive to buy a cup of coffee at Starbucks than it is to brew it at home.  Yet people still do it.  What does that cost difference tell us about the value of convenience?  Here’s one of Starbucks menus:

IMG_2748

There was definitely a period at the beginning where students did not know how to begin – or perhaps what they were suppose to do.  It took some time for them, and to extent me as well. to define the question.  I told them that it is natural in any problem solving situation to spend time defining the question, framing assumptions, setting up your analysis.

My teacher moves were as follows:

– Write about a time when you paid extra for convenience.  Talk it out.

– Ok so the value of convenience depends on how convenient the thing is versus the alternative.  [Future project could be to quantify convenience itself, rather than only focusing on Starbucks pricing].   That means we should standardize the convenience we are analyzing.  So let’s look at convenience through the lens of Starbucks pricing.

– What does the pricing of Starbucks coffee tell us about the value of convenience?  How could we use Starbucks to quantify its convenience.  What information would we need?

– Give various pricing data

– Ask students to come up with a value for the convenience of the k-cup vs. ground coffee, or the value of going to Starbucks versus brewing at home.

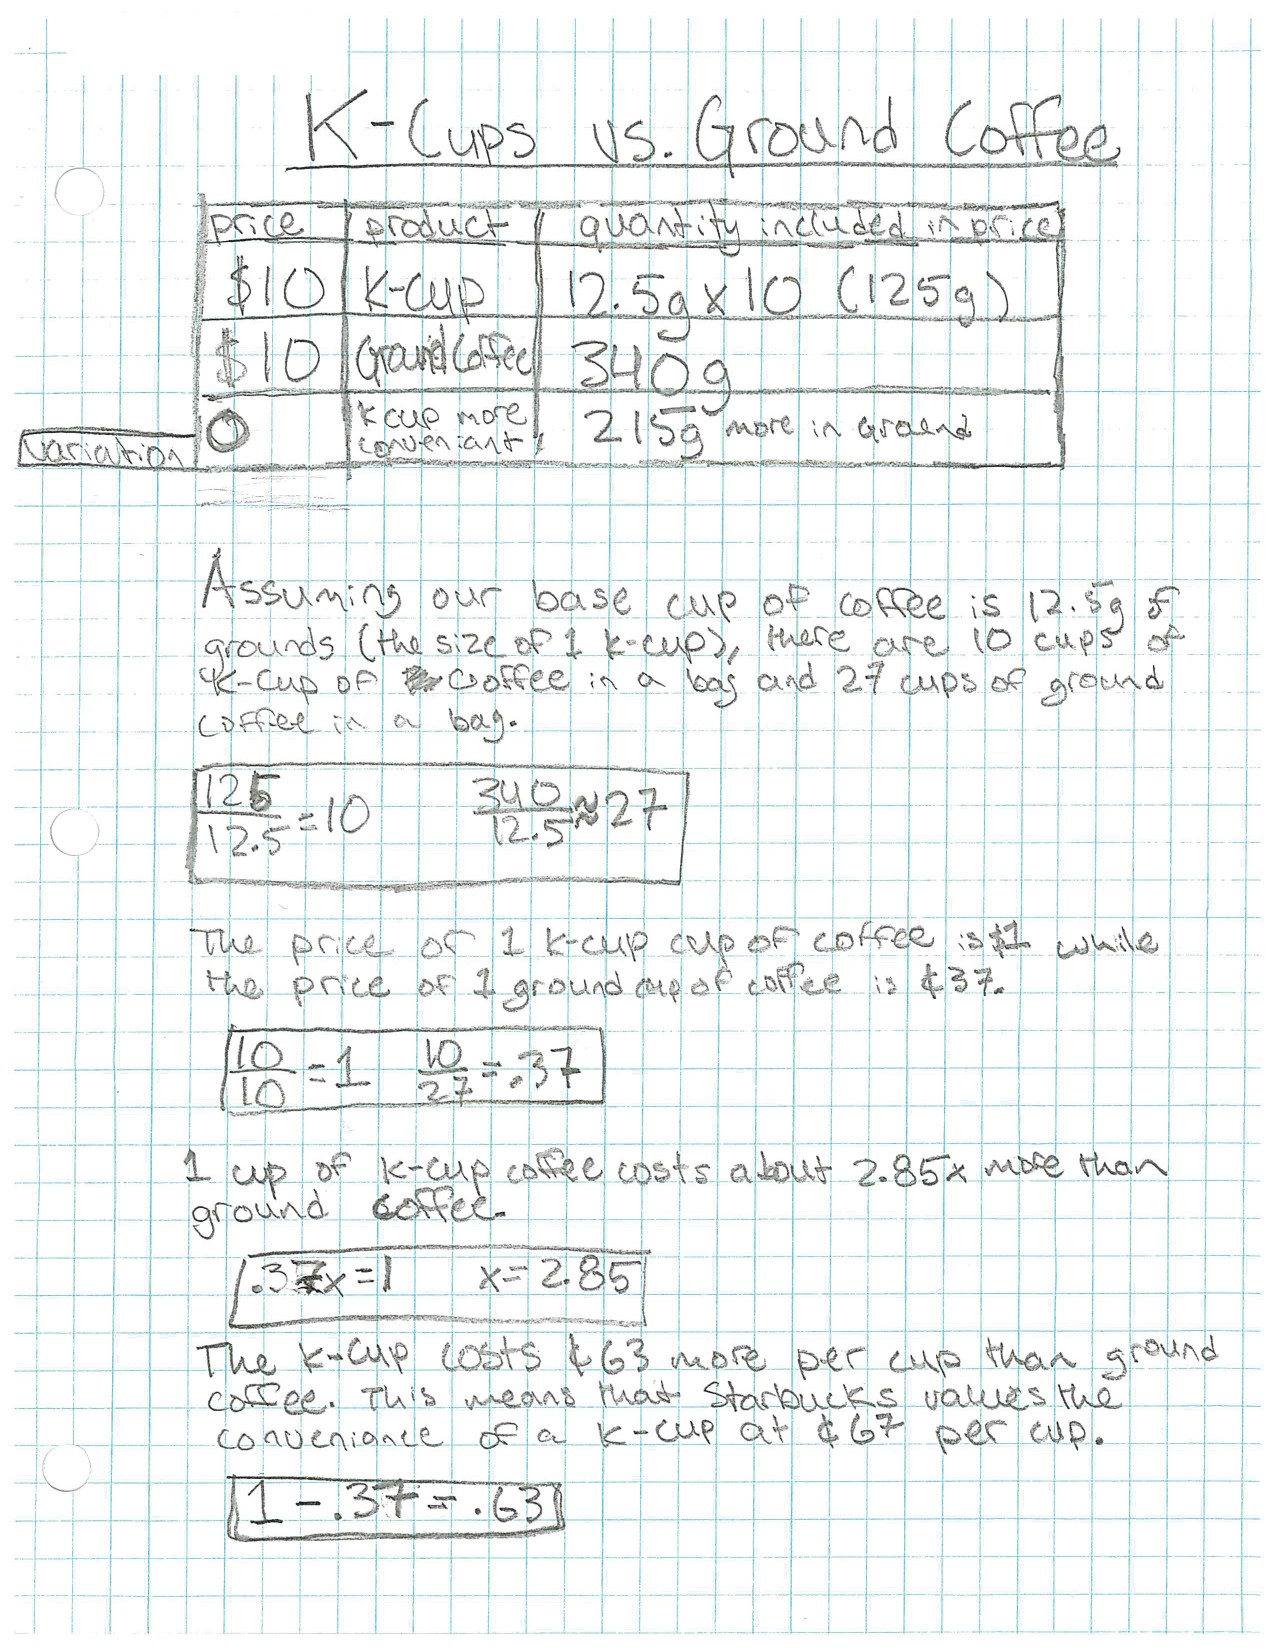
– Helping individually.   My most effective question was “For $10 you get 340g of ground coffee.  How much would it cost to get 340g of coffee in K-cups?”

It is also an interesting conversation that ground coffee and whole bean are the exact same price.  So Starbucks is saying that the convenience of having the beans ground for you adds no value to the product.

After the activity we read an article from Proffer Brainchild titled “ADDING VALUE:  A Lesson From Starbucks”

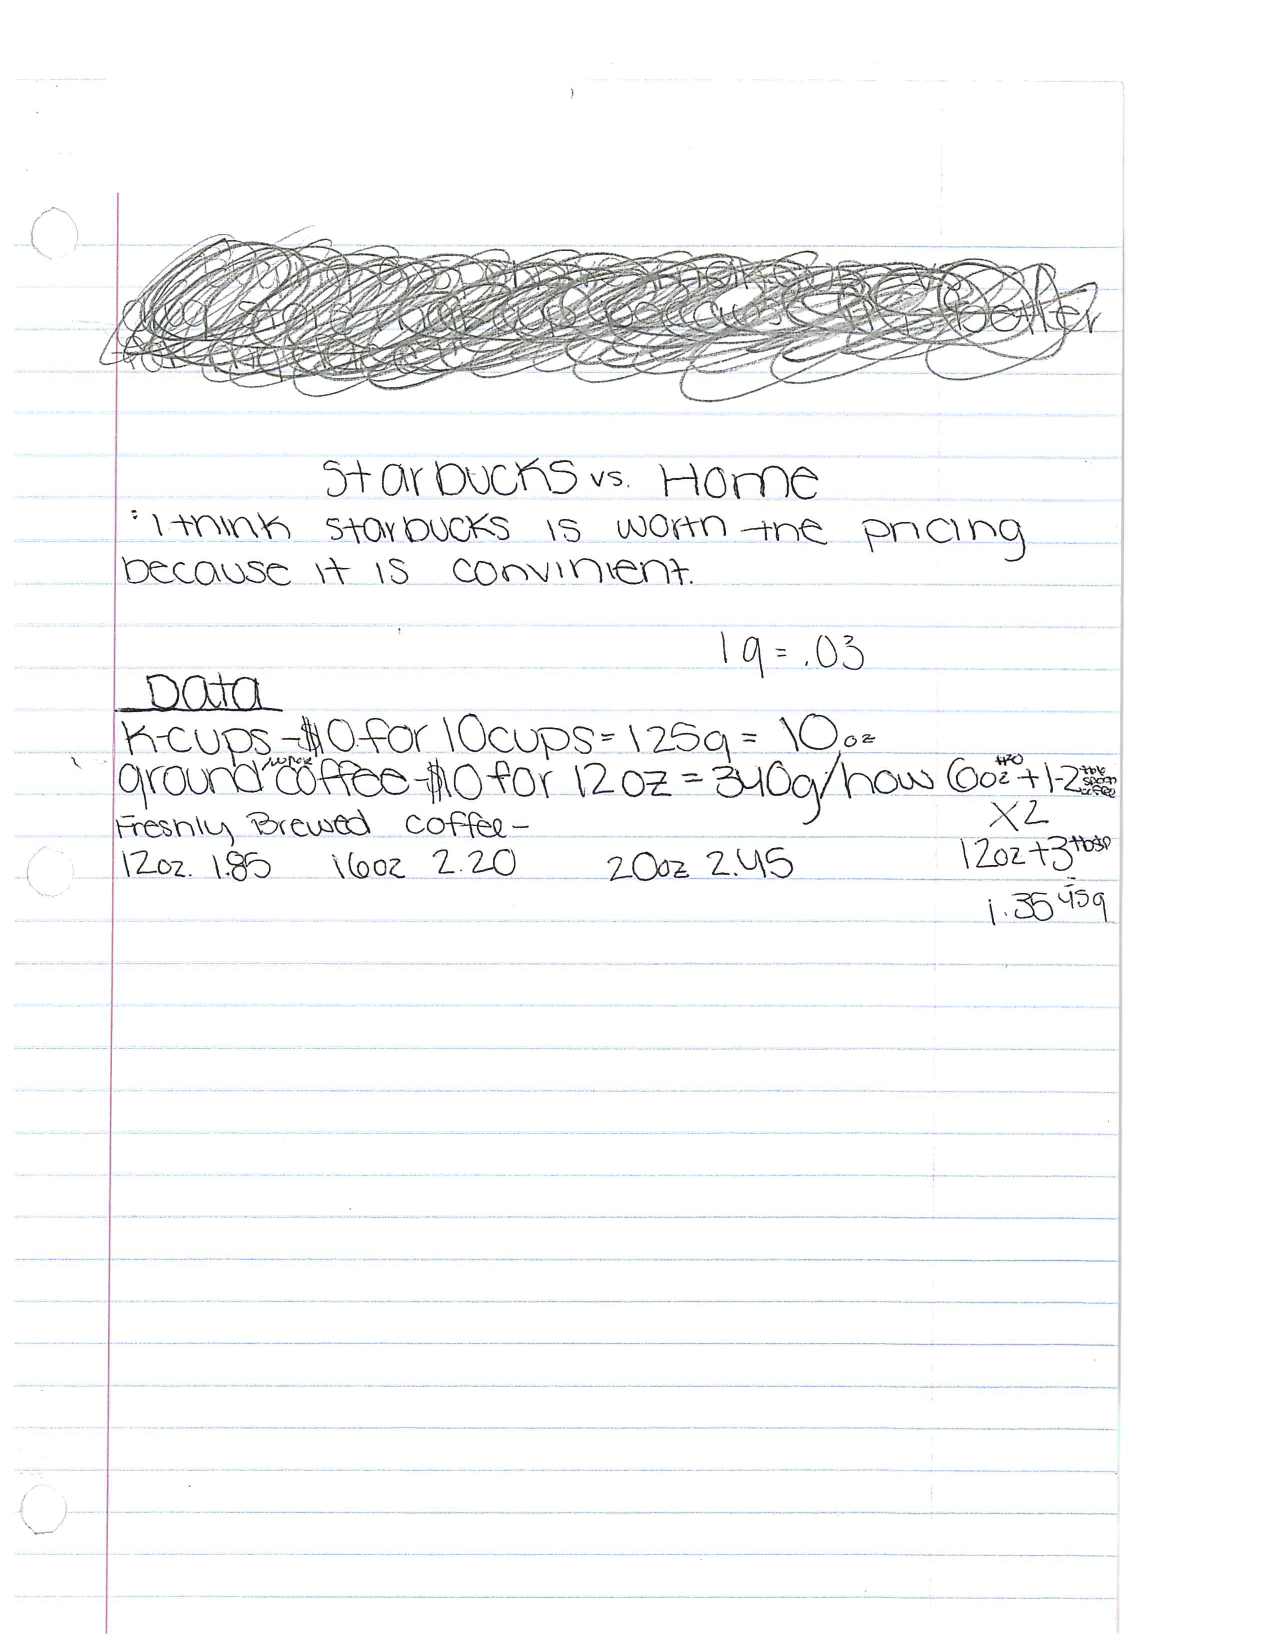
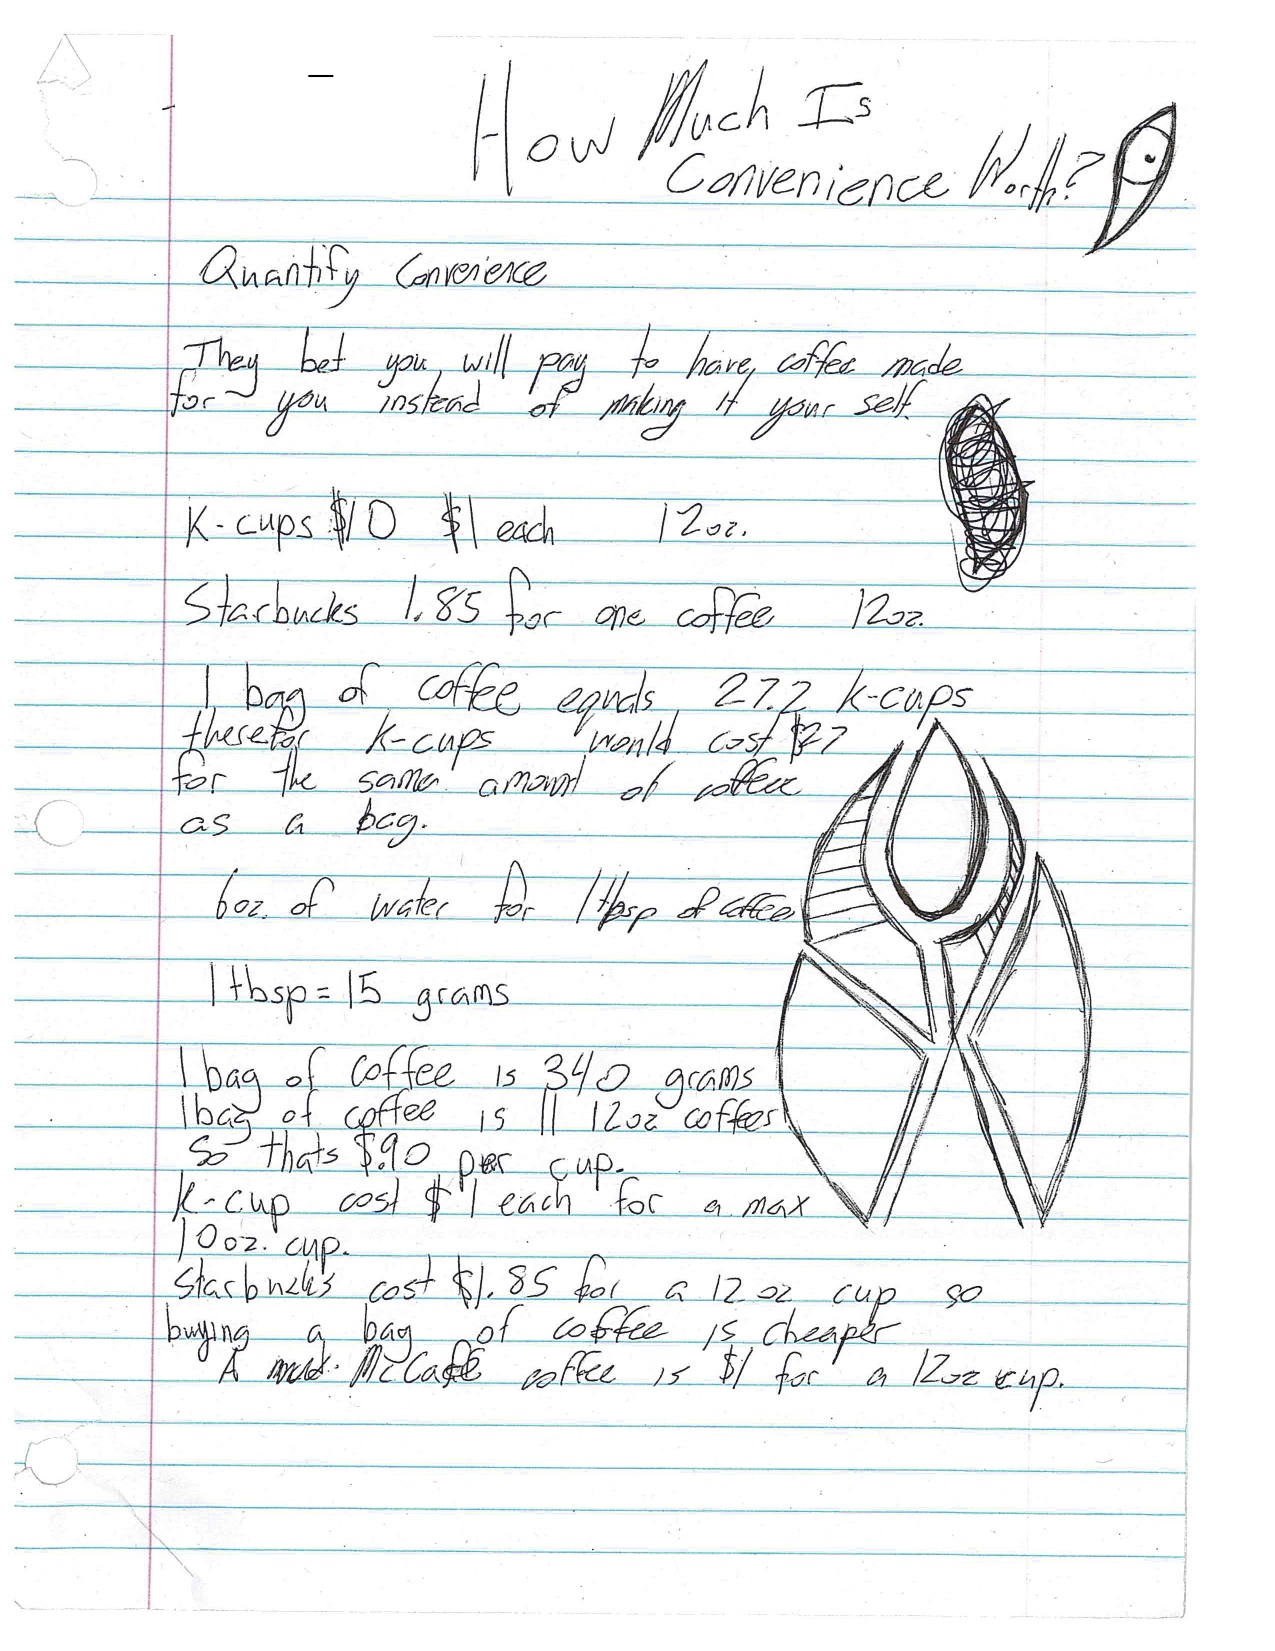
Here are some examples of student work.  The first example was the highest quality paper I received.

SW_AddingValueOliver


SW_AddingValue2


SW_AddingValue1

Lesson Learned:

It’s clear that not all students understood what I was asking – and so I concede that “What’s the value of Convenience?” was not a good driving question for this particular activity. I do see it that prompt as a great math modeling problem where students try to quantify an inherently qualitative thing. But that’s not what they were doing here.

Next year I am going to try and focus first on the k-cup vs. ground coffee prices and stick the economics concept of “adding value”. How much value is added when Starbucks puts their grounds in K-cups vs. ground coffee? And this is not just about the calculations, it’s about the argument.


SW_AddingValueZoe1

SW_AddingValueZoe2

Grazing Goat Problems (Sector Area / Trig)

I used to give this worksheet but now I draw the picture on the whiteboard and give the question orally.  Then I provide them a couple of minutes of silent time to work alone in their notebooks.  From there I group them and they work the problem at vertical erasable surfaces.  Here’s the basic question:

A goat is tethered to a 25 foot rope attached to a rectangular barn at point A.  What is the total grazing area available for the goat?

FullSizeRender_1

I leave them room to experiment – especially as to how to handle the situation when the goat starts to walk around the barn.  Last year I took them outside, gave a student a rope and they played the goat, with a picnic bench as the barn, and modeled the situation.  I didn’t do that this year for reasons I hope aren’t my own laziness.

But my goal is not just sector area, it’s also trig functions and thus onto to the triangular barn!  I mean – most barns are triangles aren’t they?  Here’s the next problem:

FullSizeRender

Some student work examples

IMG_2433 IMG_2434 IMG_2435 IMG_2436 IMG_2437 IMG_2438

The different iterations on this problem are pretty much endless:

100GrazingCow2

I did this lesson the day after the students learned how to find the area of a sector.  I followed it up with another grazing goat problem the next day where they were working on paper by themselves.   It’s not like they knew exactly how to do the problem the next day  – but it was that they all persisted, asked questions, and got to a final conclusion.  So I’m happy.

I like this question because although it is not real world – it is about real things that students understand.  I also think it finds itself into the flow of a classroom where students find it appropriately challenging – they believe they can do it but yet the solution doesn’t seem immediately obvious.

Oh, and I teach in a community with a lot of agriculture and the students told me that you really don’t tether goats.  Lucky for me that didn’t stop anyone from solving it.

Letting (making?) Them Figure It Out

I introduced exponent properties this year by writing this on the whiteboard and asking them to make observations about it.

Exp

Then I got more direct about the kind of observations I was after

ExpQs

There was some back and forth as we discussed what it means to simplify and how to simplify.  I was short on answers and kept the discussion geared towards observations.

I lined up another example where there was a negative exponent

FullSizeRender-6

From here I gave them a little half sheet with six expressions on it – grouped in them in groups of two – and off they went simplifying (do I need to add that I had them working at VNPS???).

I spent less time this year than normal covering simplifying expressions and I didn’t notice that students were any worse at it – so I’d say this approach was a success.  The next step I suppose is to apply it to other procedural concepts.

How many of the mathematical practices can we get at when we introduce concepts based in procedural fluency?  That question is swimming through my head as I begin to teach factoring.

Rotations Worksheet

Some days you just need a worksheet.  So here’s one.  I took all the problems from math-drills and just spaced them out better.  I love using matrix notation so always have my students do it.

RotationsWS1

RotationsWS

The Goods: (aka:  The pdf’s)

RotationsWS

VNPS & VRG Tango!

So Kristen and I are taking dance classes – so any three step process feels like a tango to me.  This activity has nothing to do with dancing (sorry).  This is one way that I use Vertical Non-Permanent Surfaces (VNPS) and Visible Random Groupings (VRG) for problems where we are working on our procedural fluency – whether it being solving equations with fractions, or factoring polynomials.

One down side of VNPS is that students believe they are finished when the correct answer reaches the whiteboard, rather than when everyone in the group understands how to do the problem.  The one student who knows how to solve it just goes up to the board and solves it.  There are a couple methods to help give students less places to hide in a group – here’s one of those methods:

Pick three problems that are similar.  Tell students that there are going to be three rounds.  In the 1st round they will be in groups of 3 (randomly assigned of course).  Then in the 2nd round they will be in groups of 2 (randomly assigned again of course), and lastly they will be back in their seats working alone on paper.  That’s it.  Throw whatever standard you want at it.  I believe it works because the thought of eventually being alone gives them the extra motivation to learn from their group.

Here are the three problems I started with in my geometry class, where my goal was to give them practice multiplying polynomials, solving by factoring, and using pythagorean theorem:

geo1

geo2

geo3

From what I’ve seen – the knowledge that they are eventually going to be alone makes those students who usually look for a place to hide in a group more apt to contribute and learn from the first two rounds.

I love to pose the question by waiting until they are in their groups and standing at whiteboards, then I pose the question on my whiteboard in the center of the room.   It’s a nice math coach moment versus math teacher moment.

Here’s a smattering of whiteboard activity from this day:

whiteboards1

whiteboards2

.

Learning To Teach The Great Lessons

You don’t have to write great lessons.  But you do have to teach them.  The best lessons in the world – if delivered by an untrained hand, are sure to fall well short of their potential.

So let’s say you find the perfect 3-Act lesson from Dan Meyer, or real-world application from Mathalicious.  And you are stoked.  Now what?  Well, filling this out is a start I am implementing this year:

3ActOrganizer

I recommend not leaving any of this to chance.  Your natural teaching skills will have plenty of time to shine during the lesson – but I recommend formally addressing (which to me means write it down) the following important aspects of allowing a great lesson to reach its potential:

1. Focus Question:
What is the main question(s)  the lesson meant to address.  This just focuses you.

2. Reason(s) I Think This Assignment Is Great
Remind yourself why you choose this particular assignment out of the great sea of possibilities.  What makes this lesson so great?  And as a bonus, you should start to see a pattern as to what you value in a lesson.

3.  What I Want Them To Learn
Write the skill, or standard, or whatever it is you want students to take away from this lesson. Again – it is important to formally confront it here so you make sure it happens.

4. How I Am Going To Set It Up
What’s the hook? What’s the scaffold? How is the question going to be formulated?  Give this the time it needs because if you mess this up it’s hard to recover.

5. How I Will Help Students Who Don’t Know Where To Begin
I started prepping myself for this a couple years ago and it pays off big time.  Have your response down so you can give the student the right hint and then move on. Maybe have a visual print out ready to go.

6. These Are The Most Likely Mistakes
List them out and also talk about how you will address them.

7. The Extension Question(s)
We have to have somewhere for the top students to get the question to ensure everyone is challenged. Be specific about what the extension is and how you are going to pose it. Be very careful of anything that sounds or feels like busy work.

On the back of the paper I would reflect on the lesson as a whole.  Here are the two I filled out for my 1st day of classes this year:

IMG_2026

Geostationary Satellites in 3 Acts

Need an interesting way to teach circle properties?  Me too!  And as a bonus this lesson also has the Pythagorean Theorem and extension questions that provide some advanced geometry for those students who are hard to challenge.

And don’t get intimated by satellites – just go here and read up.

The Hook (aka: Act 1)

A stunning time-lapse over the Swiss Alps.

[vimeo 61451883 w=500 h=281]

Chalandamarz of geostationary satellites in the nightsky over Diavolezza from Roland Stalder on Vimeo.

See anything interesting?

Spoiler Alert!  Some of the stars are not moving.  Students will pick up on that and it will cause a sense of intrigue.  I’ll bet you a beer that it will.  The reason the stars aren’t moving is because they are in a very special orbit called “geostationary orbit” so they are matching the earths rotation exactly.

Me:  “Any explanation about what these stars that don’t move are?”

Students give some opinions about what is happening here.  Address them and discuss them.  No fear – spend some time googling and you will be able to talk intelligently about that.

Me:  “What else do we notice about these stars that don’t move?”

The key here is that not only do some stars not move, but the ones that don’t move also appear to be in a straight line rather than randomly dispersed about the night sky.    Now let’s make the point a bit more dramatically with another video – this video gives away the answer about what these crazy unmoving stars are in the title:

[vimeo 39536582 w=500 h=281]

Geostationary satellites in the Swiss Alps from Michael Kunze on Vimeo.

The goal of this intro is to pull the students in and get them interested in this amazing, kind of creepy fact, that some of those stars in the night sky are actually satellites looking down on us.  Now I get into the slide show and talk about satellites.  I can give you that if you want.

Take a look at this cool image of the earth as a beehive of satellites.  That outer ring is geostationary orbit.  It’s literally a ring that is 22,336 mi above the earth.  Safe to say retail space up there is limited and in high demand.

312941main_Bee-Hive-1_H1_full

Oh what the hell – let’s just crack up our speakers and really draw the students in by showing them the launch of a geostationary satellite.

http://youtu.be/Gz40PihX690

OK, table set.  Here’s the two questions we’re serving up:

1.  What percentage of the earth can a single satallite cover?

2.  How many satellites are needed to cover the entire earth?  By the way – a system of satellites is called a satellite constellation.

I’m also going to have them make a scale drawing of their satellite constellation and write a generate equation for the amount of earth a satellite can cover based on it’s height h above ground.

The Data: (aka: Act 2)

I made a handout which a bunch of satellite information on it that I gives students.  It has more than they need, so it forces them to filter out the unhelpful things.

geostationary orbit – 22,336 mi

earth’s diameter – 7920 mi

Screen shot 2014-07-29 at 4.12.21 PM
This Diagram Is From American Academy of Arts & Sciences

Perhaps more specifically here – we are figuring out how many communication satellites in geostationary orbit we will need to provide communications to the entire earth.   The complication here is that communication satellites are line of sight with each other, and with people on earth.  Meaning you have to be able to see the satellites to use them – and they need to be able to see each other to transfer the signal.

The Answer:  Act 3

The math says 3.

Screen shot 2014-07-29 at 4.56.56 PM

Thanks for the nice image Purdue

But Lockheed actually uses 6!  Don’t take my word for it – check the last paragraph here from spacedaily.com:

SpaceNews

So why do they send 6 satellites when they only need 3?  Great question!  The 4th satellite is needed for “full capacity” because due to the earths shape (stupid non-perfect sphere) there a small portion of it that needs the 4th, but 3 covers most of the earth. The 5th and 6th are to “add capacity”, which is engineering speak for increasing the amount of computing power the satellite constellation is capable of providing.

Screen shot 2014-07-29 at 4.13.12 PM

 The Extensions:

This problem can be pretty much get as difficult as you want it to be.  Here are some ideas:

1.  Line of sight is actually not sufficient to ensure communication with satellites.  The elevation angle from the observer to the satellite must also be greater than 10 degrees.  How many satellites will we need to cover the earth given this restriction?  For more detailed information on this question, go to page 19 of this document from the American Academy of Sciences.

Screen shot 2014-07-29 at 4.10.39 PM

Screen shot 2014-07-29 at 4.38.34 PM

These Diagrams Are From American Academy of Arts & Sciences

2.  Can the constellation ever cover 100% of the earth?

Umm, nope.  Geostationary satellites have to be located somewhere in a ring directly above the equator.  If students derive the general formula for the amount of coverage for a given height it will look like this:  

Screen shot 2014-07-29 at 4.46.27 PM

No matter how big h gets, cosine will tend to 1, but it will never be exactly 1 and thus we can never hit 100%.  The north pole can never be reached by a satellite in geo orbit.

3 . What is the worst case communication delay between someone on one side of the earth and someone on the other side?

4.  Write a general expression for the percentage of the earth that a satellite can cover based on it’s height.

The Goods 

Here is the worksheet I used – I don’t necessary like how it’s formatted, but here it is:

GeostationarySatellites

GeoSat2 GeoSat3 GeoSat4


Explaining “Explain”

Here is a released question from Smarter Balanced (I even answered it!!!):

ExplainingExplain2

Ok I lied.   That was an edited version of a Smarter Balanced question – here’s the original:

ExplainingExplain1Now all of a sudden my answer doesn’t seem sufficient anymore 🙁   Here’s my best guess at a popular student answer:

ExplainingExplain3

This word “explain” is keeping me up at night lately.  In this problem I’m not sure adding the word explain to the end gains us enough to warrant it.  To achieve Common Core we can’t just throw the word “explain” after every problem we did last year and call it a day.  By the way I’m not saying that’s what the Smarter Balanced Consortium did on this particular problem.  But this use of the word “explain” does bring two things to mind:

1.  It’s hard to explain your mathematical reasoning without access to drawing diagrams.

2.  If we ask students to explain something – it should be something worth explaining.

With respect to #1 – my focus this year has been on explanations through multiple representations.  Basically I have students make connections between diagrams, tables, graphs, mathematical symbols, and written descriptions.  I feel underwhelmed asking students to explain with just a typed explanation.  I want explanations to look like this:

SGBridge

In the student work above – image if it was only the conclusion.  Look at how much would be lost.

There are certainly better answers to the rectangle problem from Smarter Balanced than I offered up here.  I actually really like the problem itself, I just do not think having them explain it gains us much versus just solving it.

It’s hard to explain the word explain.  It’s a word that only makes sense to me until I try to explain it.

The Handshake Problem

The Overview:

I had a lot of fun with the Handshake Problem this year, so I figured I would write about it.  My goal was to use less structure (meaning no worksheet – especially one with pre-staged t-tables).

I revealed the question in three parts, each time raising the number of people shaking hands:

– 5 people go to a party and shake every one’s hand once.  How many handshakes are there?

– If everyone in the class shakes everyone else’s hand, how many handshakes would that be?

– If everyone in the school shakes everyone else’s hand, how many handshakes would that be?

Lastly, in a rather last second “I want them to process this more” moment,  I had them create solution guides for it.

The Description:

I began with the following two questions as warmup problems:

1.  5 people go to a party and shake every one’s hand once.  How many handshakes are there?

2.  If a 6th person shows up to the party, how many handshakes will they give?

After the warmup I raised the bar a little bit by increasing the amount of people who shake hands:

“If everyone in the class shakes everyone else’s hand, how many hand shakes would that be?”

The class problem raises the bar a little, but still leaves the door open for the students to add up each individual scenario.  For example, they noticed that the 31st student would shake 30 hands, and the the 30th student in the room would shake 29 hands and so forth.  So the final answer would be 30 + 29 + … + 2 + 1.  No equation needed, no additional math tools needed.  But I still took this moment to show them a new math tool that would have made there job easier – the summation!  I pulled up the Wolfram Alpha Summation calculator and let them know that a math symbol will do all that addition for you.

WolframAlphaSummation

Then I asked them – How many handshakes would there be if everyone in the school shook eachothers hand?  Now they are dealing with a numbers that is far too big for them to simply do the summation on their own.  But luckily they had this new math tool I just gave them.  I kept that summation calculator up on my computer for them to use.  Pattern found – now execute.  And some of them literally ran to my computer to find the new sum.  Now I can ask them whatever the hell I want – If everyone on earth shook each others hand?  The size of the number is irrelevant now!  They got this.

Finding the above pattern was the most popular solution method.  But other students created a t-table and looked for a pattern to model with an equation.  They pretty quickly noticed that the equation that describes this situation had to be quadratic because we’ve looked at quadratic patterns before.  From there they made things fit and discovered the equation:  (x^2-x)/2.  I told the students that they just had to make the numbers fit.  Which was fine for the students who are good at creating equations like that.  They know what they want the function to equal, they know it’s quadratic – go to work.  The rest of the class was not amused.  And that’s when a student walked up to the whiteboard and amazed all of us.

Jose came up to the board and said, “we know that it is quadratic from the t-table.  So let’s assume there are 3 people at the party.  3 squared would be 9 handshakes, which accounts each person shaking the other two peoples hands, and their own hand.”

photo 1

“But they can’t shake their own hands, so we have to get rid of those three handshakes”

photo 2

“Here we are still double counting each handshake.  So then we must divide by 2 in order to only count each handshake once.”

photo 3

Oh my God Oh my God Oh my God!!!  That was soo excellent!  I had never thought about the problem like that!

And with this equation in hand, when I raised the bar to how many handshakes there would be if every student in the school shook hands, they saw how quickly they could answer it by plugging in the school’s population.

I had students just work in their notebooks, but afterwards I had them formalize their work and create a solution guide.  I will probably write about these solutions guides next – but for the time being, here are some nice ones:

Student1

Student2

The Reflection:

I am most excited about the idea of these solution guides.  It was kind of a last minute idea I threw together, but turned out kind of gold for me.  Ended up doing a gallery walk and have great classroom talks about what THEY liked and disliked about each others guides.  I”m looking forward to see the quality of the next round of them!  Bring on the “Guess What I Heard?” problem!!!

Real World Math: Project Manager

When I first started this blog the idea was to categorize assignments based on a series of twitter style hashtags, which would ultimately allow a teacher to quantify how differentiated their lessons had been – in a macro sense at least.  I have not really stuck to that idea, but one of the original hashtags I had was #industry.  The purpose of #industry was pretty simple – someone had to do this in their job.

I was hoping that #industry would end up as a collection of problems that come directly from people’s  work experiences.  These experiences would be served to student’s unedited from the workplace to the classroom.  Inherent in this hashtag would be the answer to the question “why?” because presumably anybody doing something for their job would have a clear reason as to why they were doing it. (presumably?)

So here’s the problem:  My fiance is a project manager and she had one site that was 3/4 an acre and a price from that site for $54,000 for some work. Then she had another site that was 2.5 acres and needed to know how much that same work would be for the larger site.  That was the first thing she needed to calculate, but she ended up just wanting to know how much 1 acre was worth, so she could scale it to all her other jobs.

Here’s an error analysis angle to this question –  To scale the cost for 1 acre she had initially multiplied 54,000 by 1.25 and she was genuinely curious about why that did not work.  Hhhhmmmmm…